DArTView
DArTView is a KDXplore plugin for marker data curation via metadata filtering. DArTView enables users to overcome the tedious manual calculation of marker data that is common when using spreadsheet applications. You may do this with the following steps:
Creating a formula for a statistic (e.g. Marker Call Rate);
Extending the formula to the entire dataset;
Sorting data via calculated statistics;
Visualising calculated statistics (e.g. via scatter plot);
Subsetting dataset based on the determined threshold; and
Repeating steps 1-4 to look at the effect on other statistical distributions.
This user guide provides an overview of DArTView, as well as functions such as those listed above. If you would like access to DArTView, then see the KDXplore Getting Started page.
Note
If you experience any issues or have feedback, don’t hesitate to get in touch with us at kdxplore@diversityarrays.com
Supported Formats
DArTView supports multiple nucleotide genotypic data types of DArT and HapMap marker data formats:
DArT
DArT Counts
DArT SNP Two Row
DArT Silico SNP
DArT Silico Counts
DArT SNP One Row
HapMap
Two Letter
SSR
Codominant
Dominant
Note
These formats will be referred to as marker data throughout this user guide.
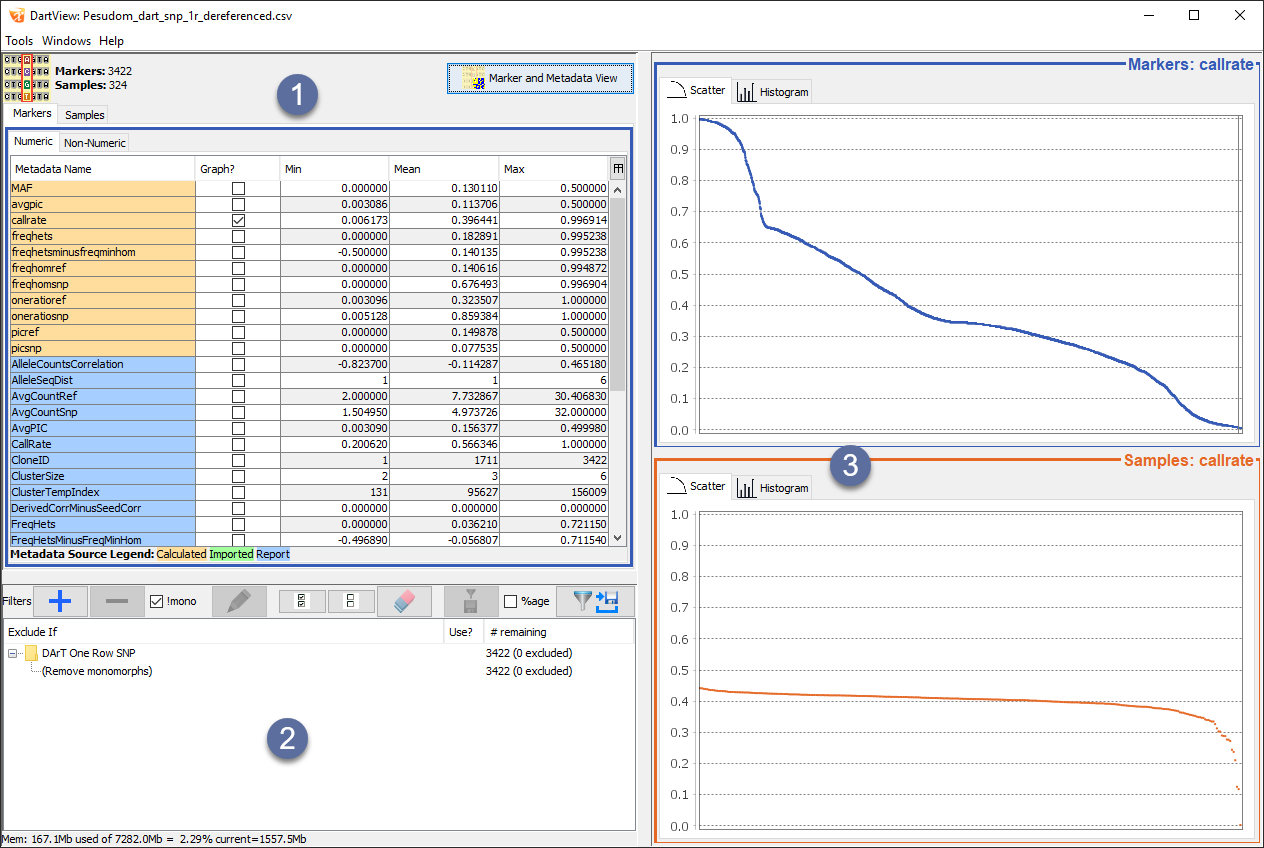
DArTView Main Window
The DArTView Main window displays an opened file and filters and graphs that you have applied. See the below image and table for more information about the sections of the DArTView Main window:
Item |
UI Element |
Description |
|---|---|---|
|
Metadata Panel |
Lists metadata that is organised into markers/samples, each with numeric/non-numeric subsections. Checked metadata are displayed as graphs in the Graphs panel. |
|
Filters Panel |
Lists all active/inactive filters added to the file and provides options for managing these filters. |
|
Graphs Panel |
Displays scatter, and histogram plots based on the filters applied to a file. |


Viewing Metadata Statistics
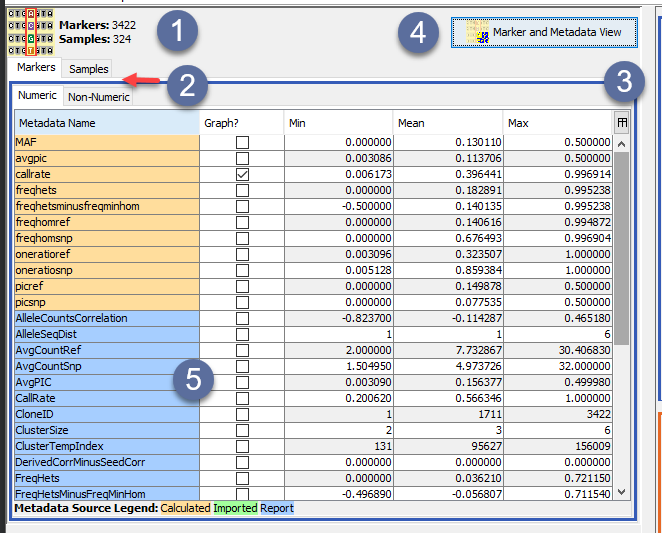
Data can be viewed after it is loaded from a marker data file. The options for viewing data are outlined in the image and table below:
Item |
UI Element |
Description |
|---|---|---|
|
Report Counts |
The total number of markers and samples are displayed here. |
|
Metadata Tabs |
Select either the Markers tab or the Samples tab to view the report’s metadata on markers or samples. The Numeric tab and Non-Numeric tab allows the user to view numeric and non-numeric metadata. |
|
Stats Button |
The Metadata panel in the above image displays only basic metadata stats. Select the Stats button to choose the all stats option which shows all metadata stats available. |
|
Genotypic Data Map button |
This button will open a window called the Genotypic Data map, where you can graph data. See the section below for more information. |
|
Metadata Panel |
This panel displays metadata according to what tabs the user has selected to view. Select the checkbox or double-click on any of the rows to display further information on the metadata. This is demonstrated in the image below, where the callrate is selected and displayed. |


Metadata Statistics
DArTView provides both numeric and non-numeric summary statistics for marker data files. The below tables lists these statistics and provides descriptions for each one:
Statistic |
Description |
|---|---|
Min |
The minimum value for this metadata statistic. |
Mean |
The mean value for this metadata statistic. |
Max |
The maximum value for this metadata statistic. |
Extended: Q1 |
First interquartile range. The middle value in the first half of the rank-order data set. |
Extended: Median |
Second interquartile range. The middle value of the rank-order data set. |
Extended: Q3 |
Third interquartile range. The middle value in the second half of the rank-order data set. |
Extended: Variance |
The sample variance of the statistic: \(\frac{1}{N-1}\sum_i^N (\overline{X} - X_i)^2\) |
Extended: Std Dev |
The sample standard deviation of the statistic: \(\sqrt{\frac{1}{N-1}\sum_i^N (\overline{X} - X_i)^2}\) |
Extended: Std Err |
The sample standard deviation of the statistic: \(\frac{\sqrt{\frac{1}{N-1}\sum_i^N (\overline{X} - X_i)^2}}{\sqrt{N}}\) |
Statistic |
Description |
|---|---|
Values |
Displays some entries of the metadata |
Source |
Description |
|---|---|
Calculated |
Metadata has been calculated using DArTView’s internal set of calculators for this data format. |
Report |
Metadata was imported from a report. |
Imported |
Metadata was imported via Import Metadata wizard. |
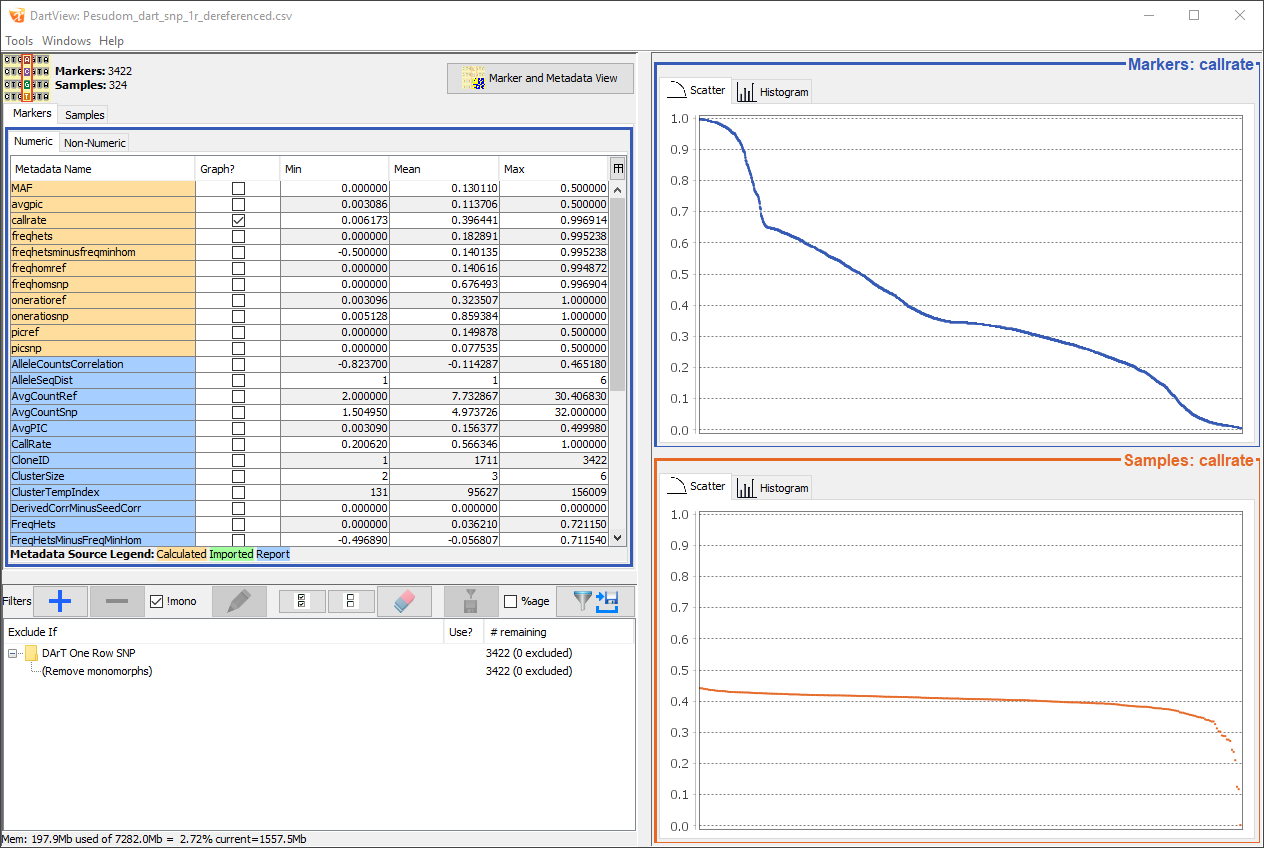
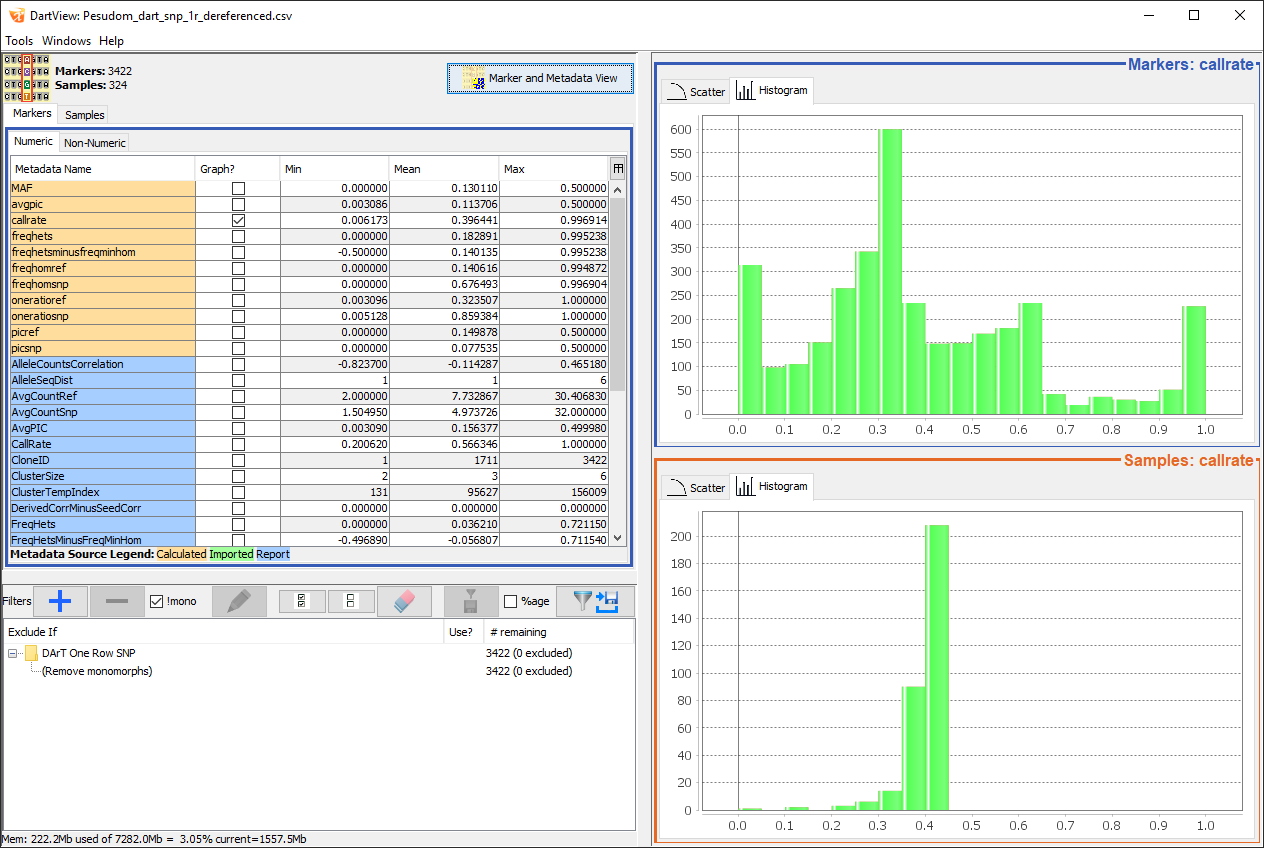
Viewing Graphed Metadata
You can view each metadata row in more detail in different graphs located in the Graphs panel. Select the checkbox or double-click on any of the rows to display more information in scatter plots and histograms of the data.
The images below are examples of the callrate being graphed as both a scatter plot and a histogram. The data is displayed in descending order as that is what order it was designated in the Metadata panel. There are also checkboxes along the bottom of the scatter plot, which provide options for marking summary statistics of the data. The median is marked in this example and can be seen with the blue line through the scatter plot.