Filtering Data
You can use filters to refine the data set viewed in DArTView. Filters can be either created or loaded from a previously saved filter file, so they are also reusable.
Filter Panel
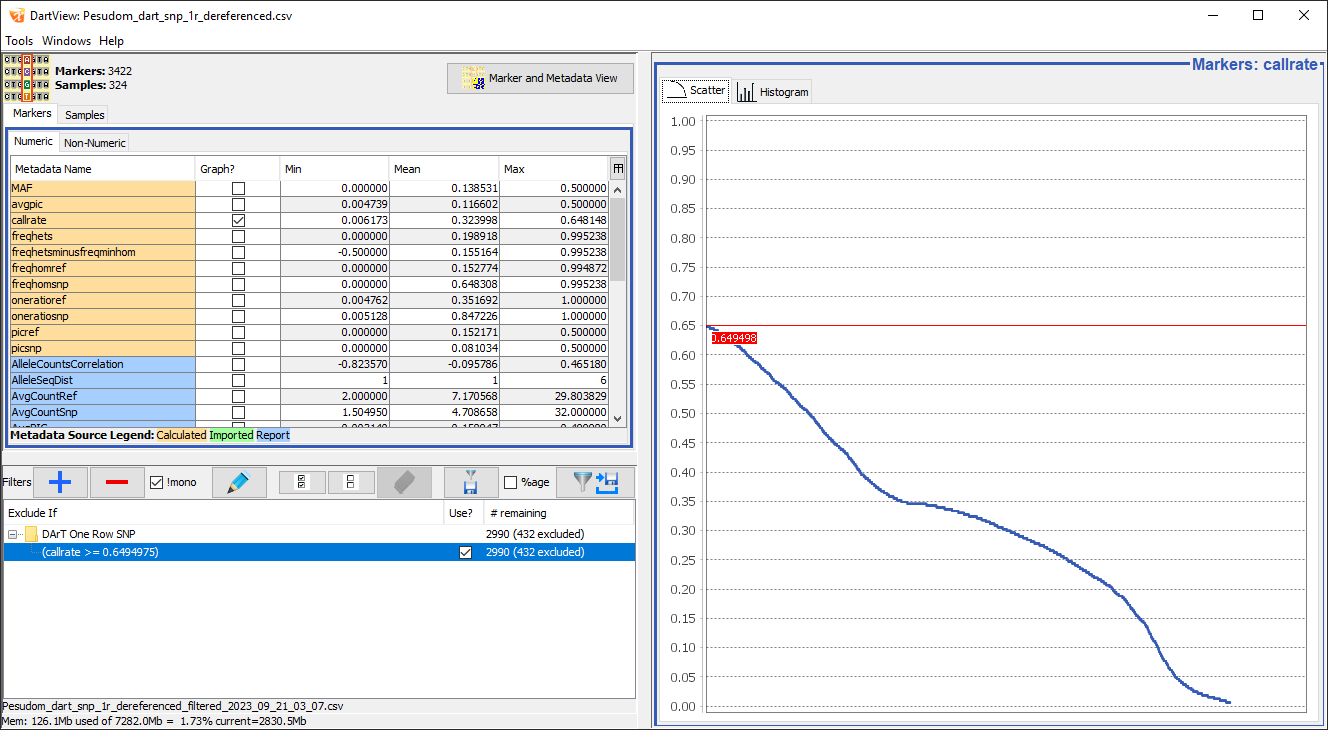
The Filter panel displays all active and inactive (checked/unchecked) filters and provides options for managing those filters.
The image below demonstrates a marker data file with a single filter to remove markers with a call rate above 0.630475. See the table below the image, which outlines the available filtering options:
UI Element |
Description |
|---|---|
|
Displays the Add New Filter window, which provides options for creating a new filter. |
|
Removes the selected filter. |
Remove Mono Checkbox (Markers only) |
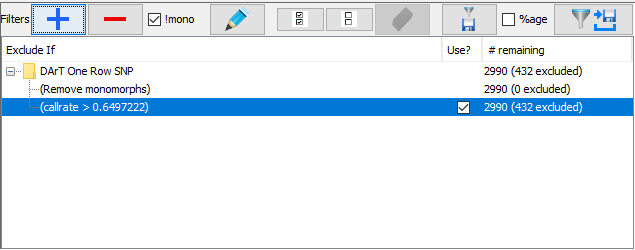
This special filter is applied only after standard filters (both markers and samples) are applied. A monomorphic marker is defined as a marker with only one allele visible across the samples (ignore missing values). Such markers are considered uninformative and are often redundant in downstream analysis. The Remove Monomorphs filter is always available by default and you cannot remove it. However, this checkbox allows the user to enable/disable this filter. |
|
Opens the Edit Filter window for editing a selected filter. |
|
Enables all filters in the Filters panel. |
|
Disables all filters in the Filters panel. |
|
Disables all filters that do not apply to the marker data file that is currently open. |
|
Provides options for exporting selected filters to a separate file so that you can reuse them again. |
Percentage Checkbox |
By default, each filter will display the number of data points excluded if the filter is active. This checkbox will display the number as a percentage rather than a count. |
|
Provides options for exporting data with the filters that have been applied. |


Exporting and Importing Filters
Filters can be saved so that they can be imported and exported when needed. See the below section on how to start importing a filter.
Importing
Importing a filter file is done by clicking+dragging the filter file from the file explorer and dropping it into the Filter panel.
Exporting
Saving a filter will create a file with saved filters from the current session. These files can be exported and used again in the future.
Step |
Action |
|---|---|
1. |
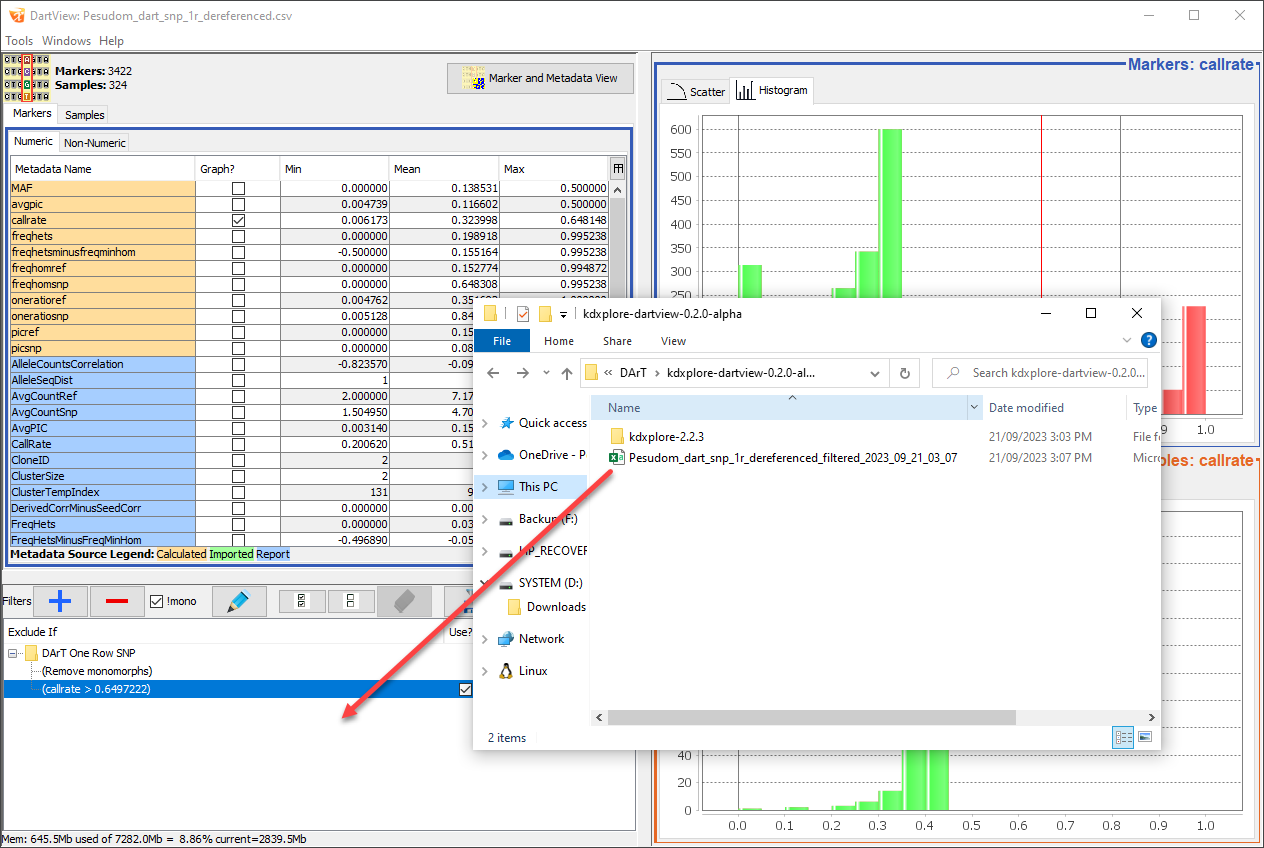
On the Filter panel, select the Export Filters button. |
2. |
Select a location to save the filter file. |
3. |
Select the Save button to complete the export. |
Creating New Filters
There are two approaches to creating new filters. The first is via the Filter panel, and the second is via the graph.
Creating a Filter in the Filter Panel
You can create filters in the Filter panel without needing to view any graphed data. See the instructions below for more information:
Step |
Action |
|---|---|
1. |
Select the Add Filter button |
2. |
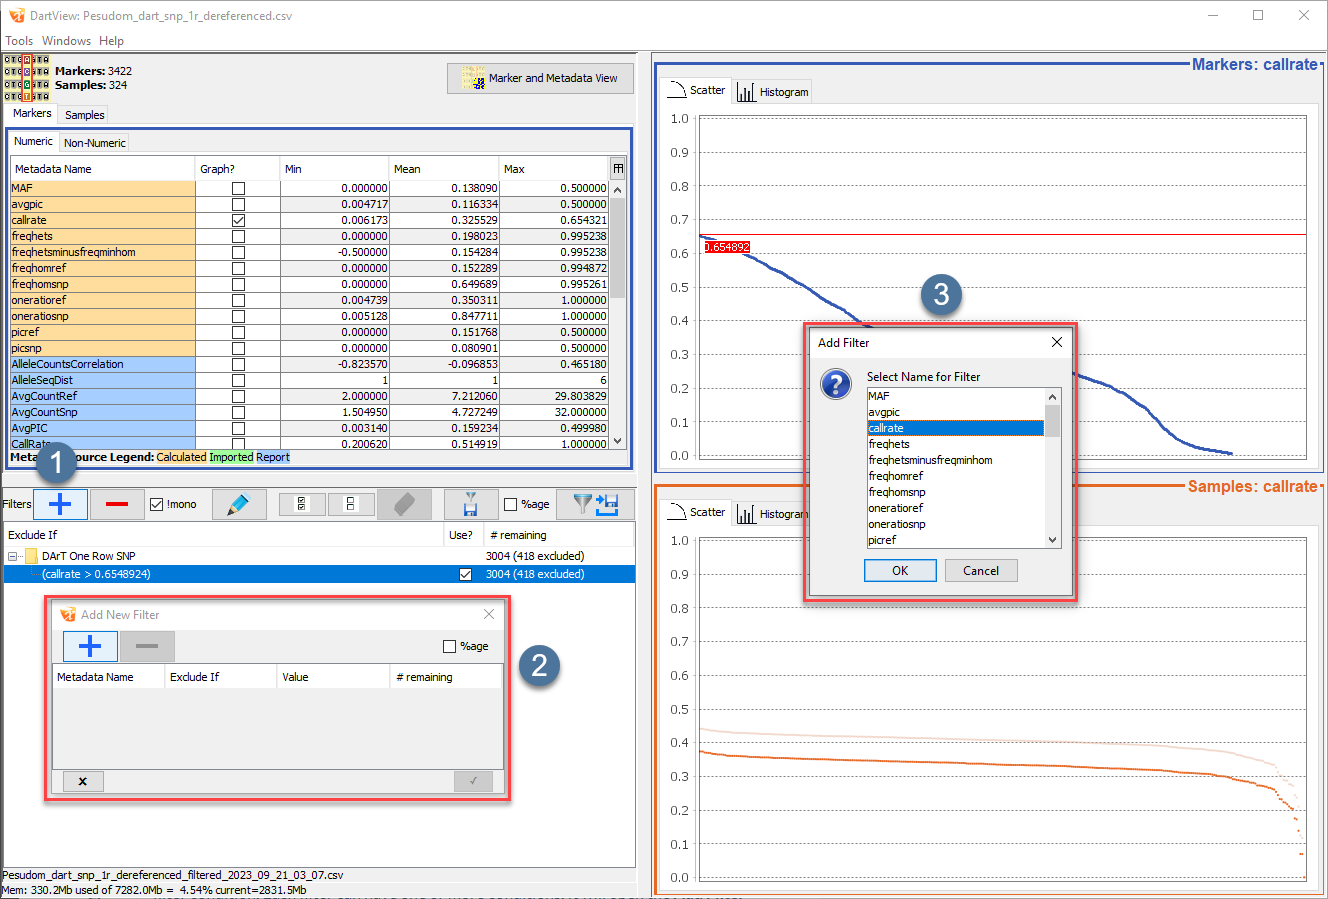
Select the Add Filter button |
3. |
Choose the metadata for the filter, then select the Ok button to finalise the selection. The Add New Filter window will be updated, as seen in the image below. |


Step |
Action |
|---|---|
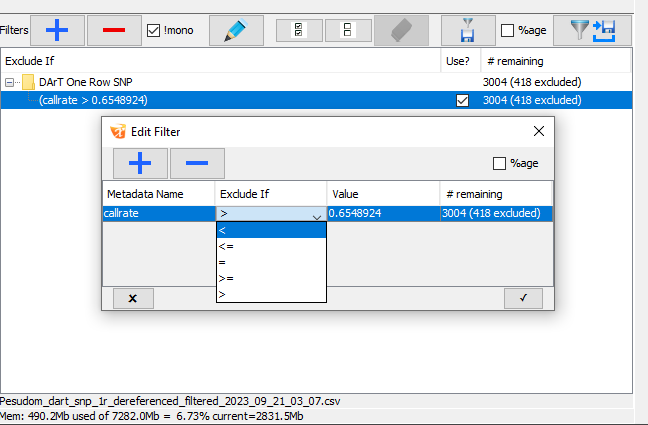
4. |
You can edit the filter condition by double-clicking the Metadata Name, Exclude If (in the above image), and Value fields. |
5. |
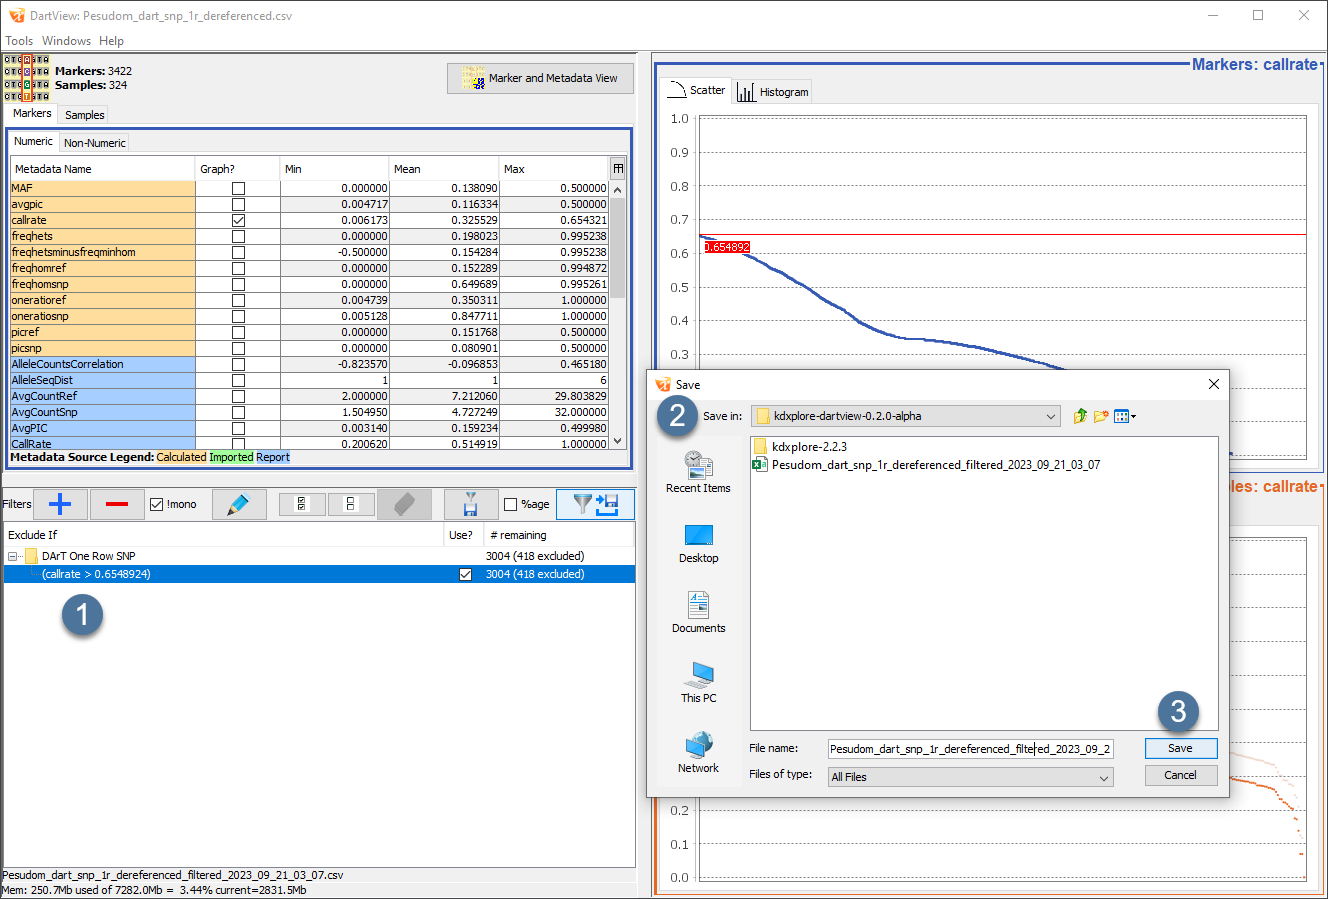
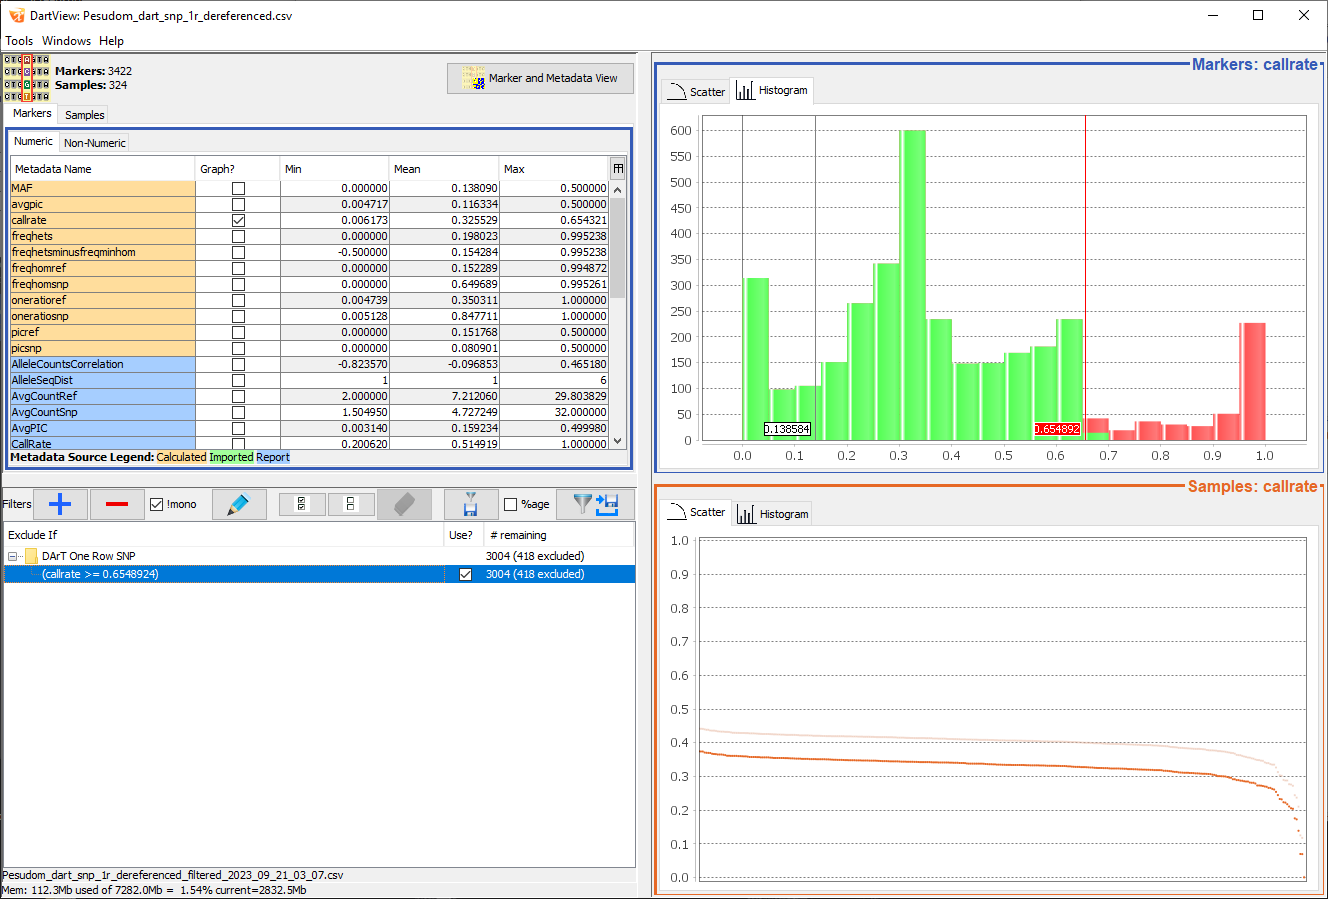
Select the Confirm button (the tick) to finalise the creation of the filter. Finally, you can update the graph, such as in the image below. |
Tip
Both the scatter plot and histogram will be affected by applied filters.
Creating a Filter in a Histogram or Scatter Plot
New filters can also be created within a histogram or scatter plot. This allows users to filter based on the graph they are viewing. See the instructions below for more information:
Step |
Action |
|---|---|
1. |
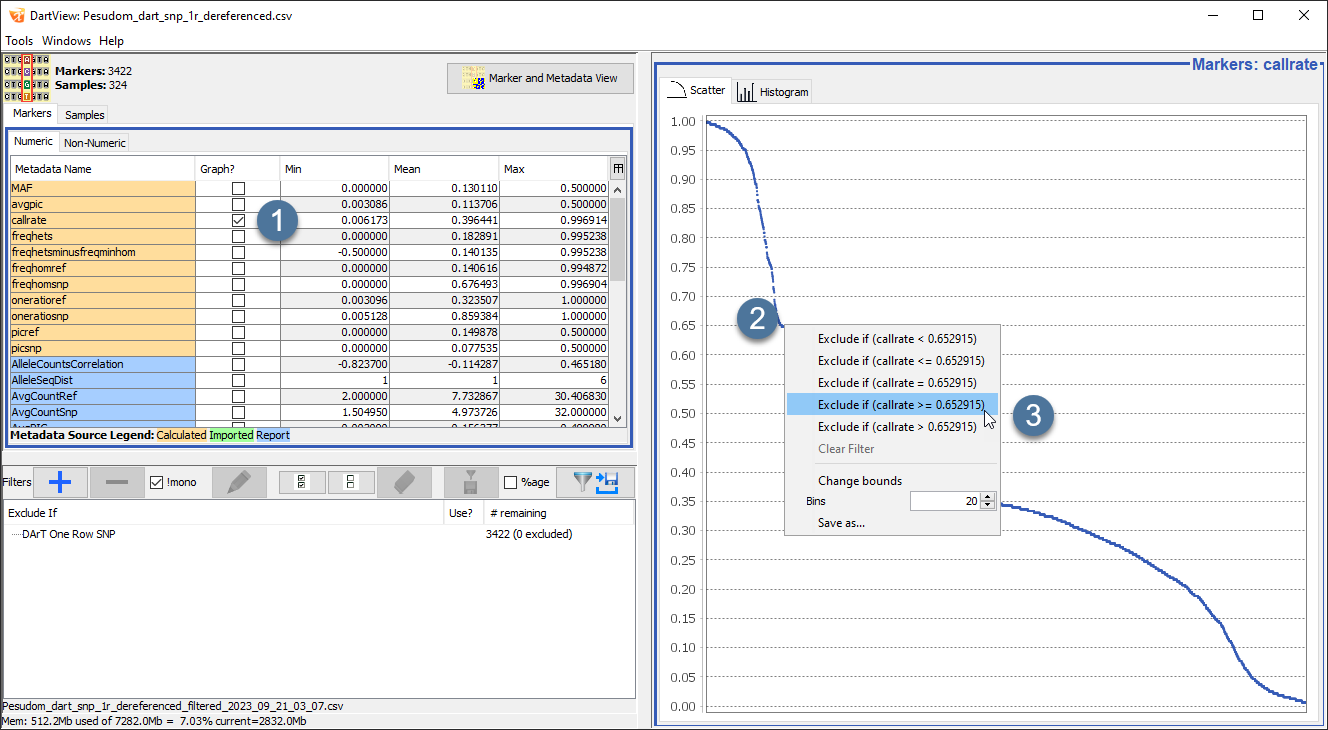
Open a histogram or scatterplot from the Metadata panel by selecting the relevant checkbox. |
2. |
Right+click in a section within the graph where you want to place a filter (in the above image). DArTView will present filtering (and other) options. |
3. |
Select a filtering option. This will add and apply the filter immediately, as seen in the image below. |