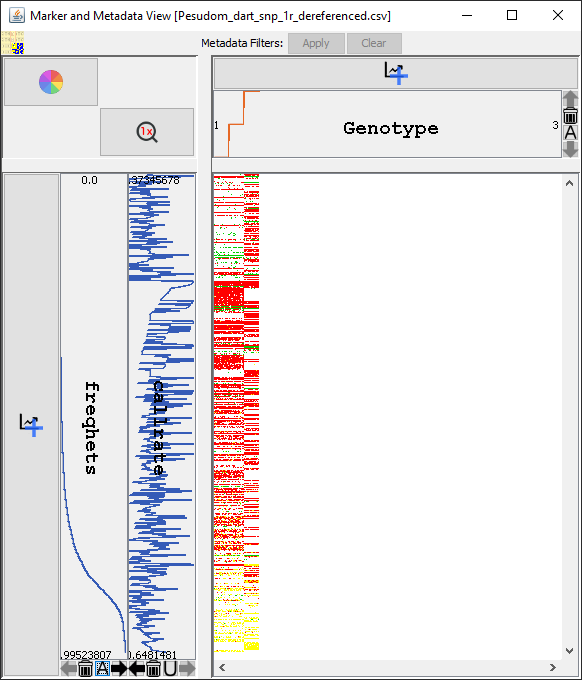
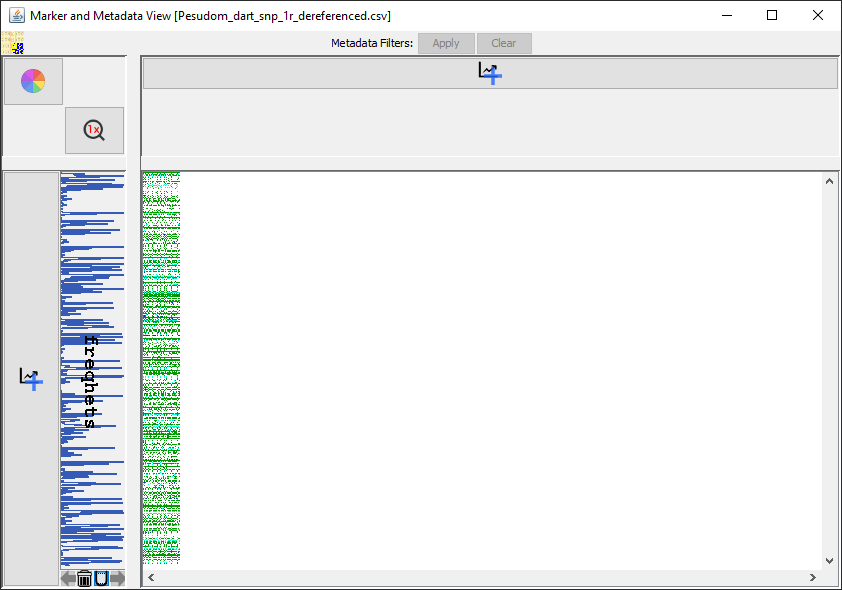
The Genotypic Data Map
The Genotypic Data map provides a contrasting image of the genotypic data before and after filtering. Along with sorting capabilities, this feature provides a quick perspective of the dataset. You can access it by selecting the Genotypic Data Map button from the DArTView Main window.
In the image below, the Genotypic Data map is sorted by marker call rate and species sample metadata imported via the Import Additional Metadata wizard.
Note
The Genotypic Data Map was formerly called the Marker and Metadata View. Future versions of DArTView will include this name change.
Genotype Data Point Colour Configuration
Each genotype data point has a call value with a representative colour. Colouring is configured by the Choose Colours window as seen in the image and instructions below:
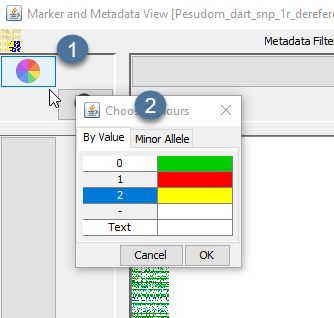
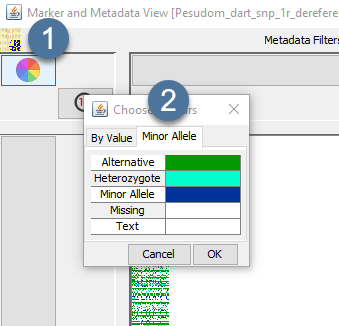
Step |
Action |
|---|---|
1. |
Open the Choose Colours window by selecting the Change Colours button. |
2. |
Navigate to either the By Value tab or Minor Allele tab. Select the colour of each genotype data point to display a colour selector, and use this selector to set the colour of each genotype data point. |
3. |
Select the Ok button to confirm the genotype data point colour changes. |
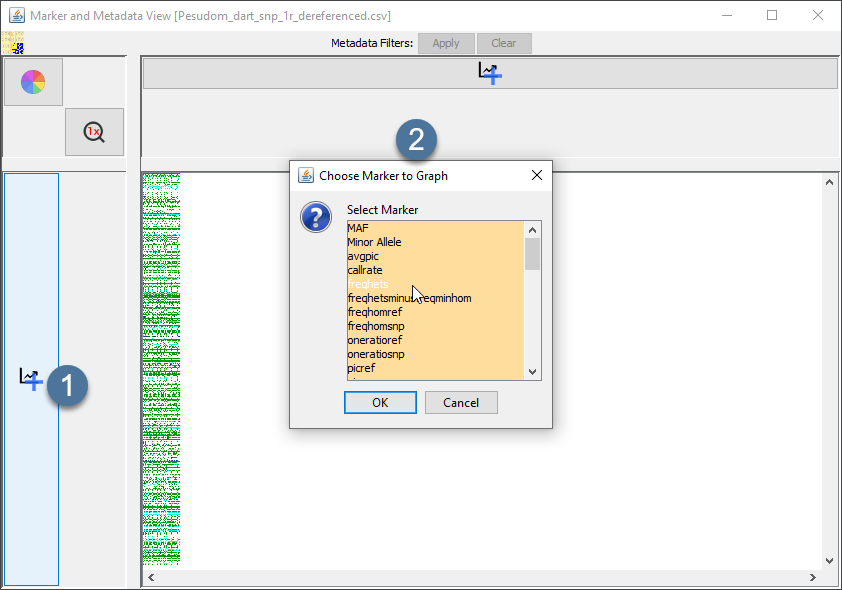
Graphing Data in the Genotypic Data Map
You can add metadata distributions of either markers or samples alongside the Genotypic Data map. See the image and table below for information on how to graph data in the Genotypic Data map:
Step |
Action |
|---|---|
1. |
Open the Genotypic Data Map window to view genotypic data. |
2. |
Select the Add Graph button |
3. |
Select a graph option and then the OK button. The new graph will be created and applied to the appropriate location. The below image shows what the example graph looks like: |


Graph and Viewing Options
There are display options available once a graph has been added. The following options are available:
UI Element |
Description |
|---|---|
|
As you can apply multiple graphs to the data, this option increases the priority of the selected graph. |
|
Decreases the priority of the selected graph. |
|
Deletes the selected graph. |
Sort |
Cycles through the following sorting options for the selected graph:
|
|
Displays a window with options for changing the colour for each genotype data point. |
|
Sets the zoom level to 1x (normal). There are more zoom options in the following section. |


Genotype Data Points
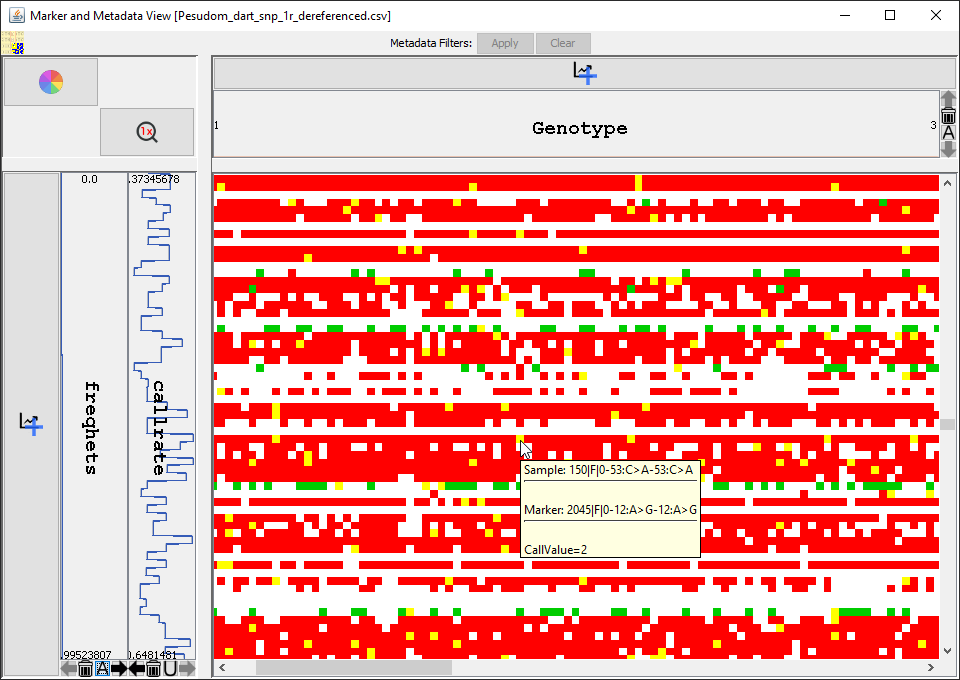
You can easily view samples, markers, and genotype data points in the Genotypic Data map. For example, hold the mouse over a genotype data point (this may be easier if zoomed in) to display the sample, marker, and genotype data point as seen in the image below:
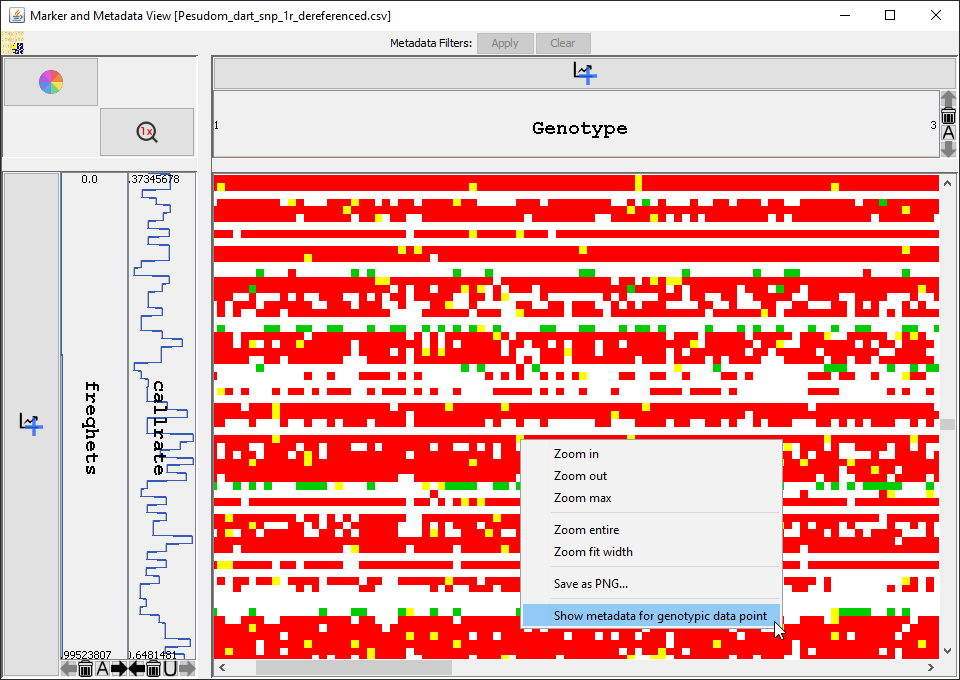
Right+clicking on a genotype data point will provide options which are shown in the image below and listed in the table below that:
Option |
Description |
|---|---|
Zoom In |
Zoom in closer to the selected genotype data point. |
Zoom Out |
Zoom out from the selected genotype data point. |
Zoom Max |
Maximised the zoom depth (which will display values as text) onto the focused location. |
Zoom Entire |
Fits the entire genotypic matrix into view. |
Zoom Fit Width |
Fits the width of the genotypic matrix into the window Metadata and Sample Data: Shows marker and sample metadata. Need to make it clear which is the marker and which is the sample |
Save as PNG… |
Saves the current genotypic data map with adjacent metadata distributions as a PNG. |
Show metadata for genotypic data point |
All information for the selected marker includes anything that was imported to DArTView. |