Curation
The Curation tool enables users to explore, visualise, and curate data for quality assurance and control. Data that is collected in the field can be transferred to Trial Manager where the Curation tool can be used to curate the data. Once data has been curated, it can be saved to the KDXplore database. It is not a standalone plugin but is found within Trial Manager.
Curation Main Window
The Curation Main window can be accessed through Trial Manager.
Step |
Action |
|---|---|
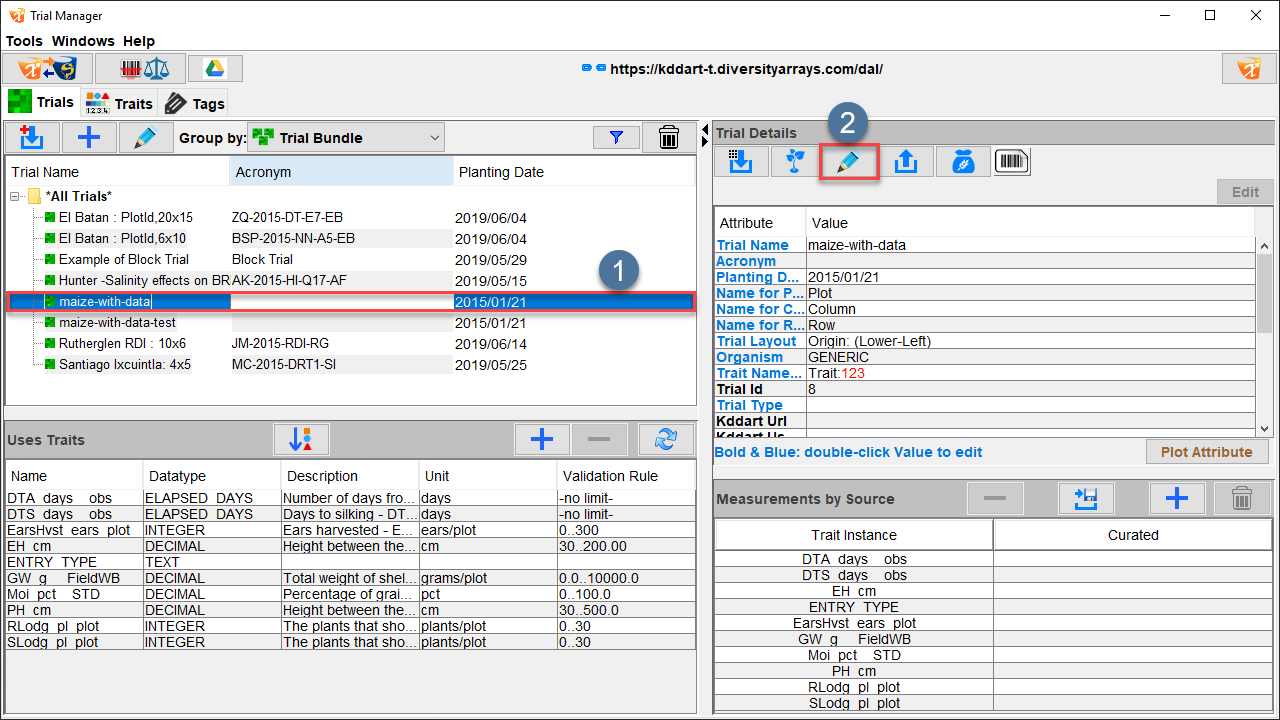
1. |
Open the Trials tab of the Trial Manager plugin and select a trial to be curated. This will display its details in the Trial Details panel. |
2. |
Select the Edit Current Trial Button |

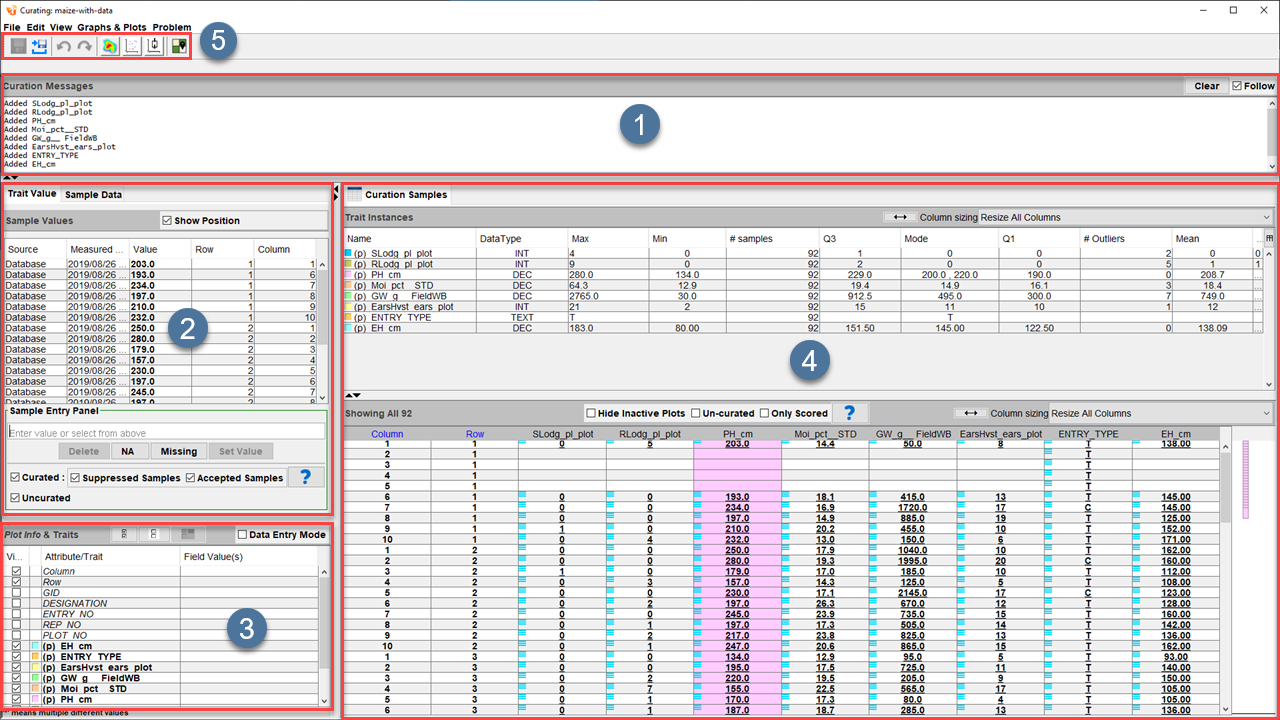
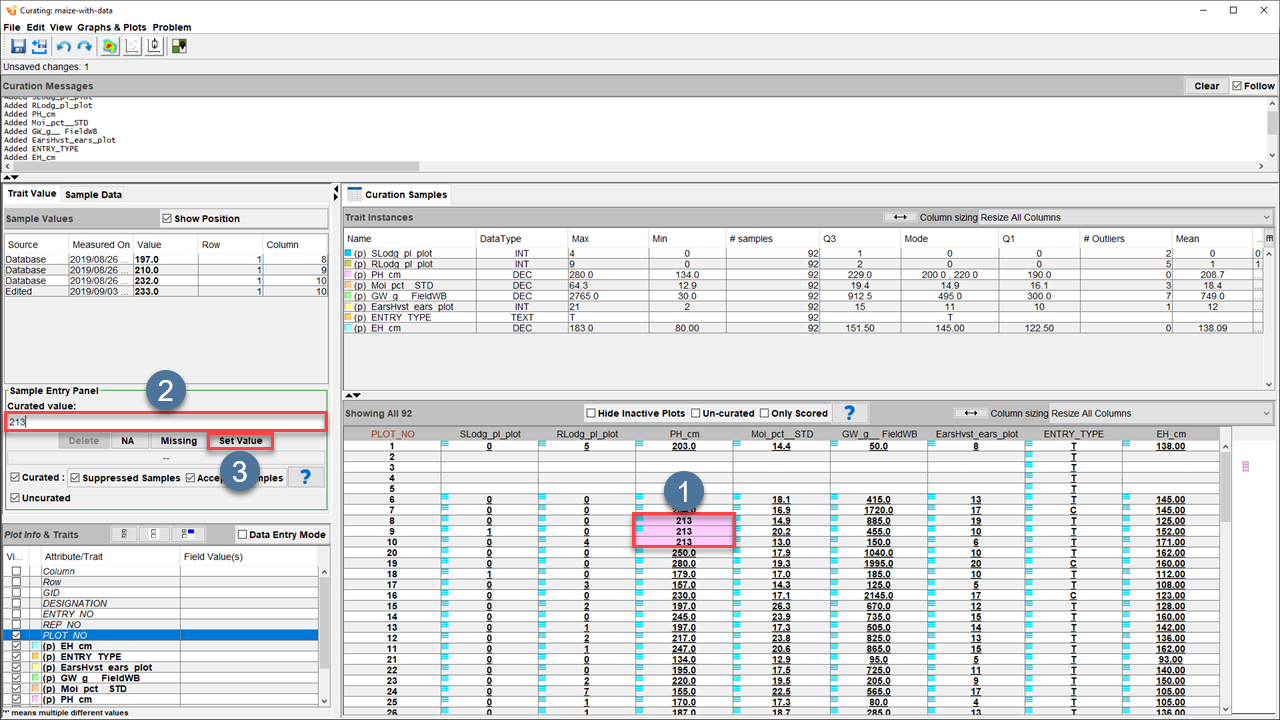
The image below details the Curation Main window and the sections that it is made up of:
Item |
UI Element |
Description |
|---|---|---|
|
Curation Messages panel |
Displays information and messages about events that are occurring in the Curation tool. |
|
Values panel |
Displays information on selected sample values and allows for the editing of values. It comprises the Trait Value tab, which contains information about one or more selected samples in the Curation Samples table, and the Sample Data tab, which provides information on the data set as a whole. |
|
Plot Info & Traits panel |
Lists all attributes and traits of the trial, which you can use to select plot info and trait measurements to display. |
|
Curation Samples panel |
Contains the Trait Instances table which lists all selected traits with their information, and the Curation Samples table, which displays all sample measurements from selected traits. |
|
Toolbar |
Provides options for saving, exporting, and visualisation. |


Plot Info & Traits Panel
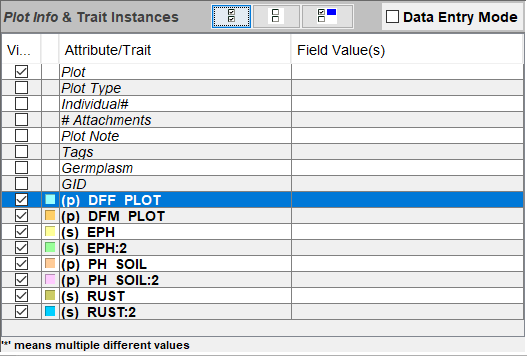
The Plot Info & Traits panel lists all of the trial’s attributes and traits, which you can use to select plot info and trait measurements to display. Any selected items will appear in the Curation Samples panel as a column.
UI Element |
Description |
|---|---|
Attribute/Trait checkboxes |
Each row on the table is representative of an attribute or a trait. Select the corresponding checkbox for each one to display that attribute or trait in the Curation Samples panel |
|
Checks all traits in the trial. This does not check any of the trail attributes. |
|
Unchecks all traits that are currently checked. |
|
Checks only a trait that is currently selected (such as the DFF Plot trait in the above image). |
Data Entry Mode checkbox |
Allows for editing of data in Data Entry mode. |


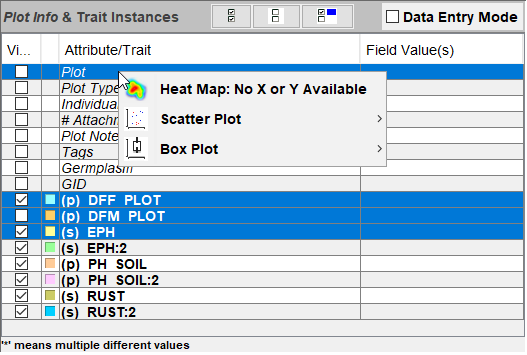
You can also select one or more traits by using ctrl+click, and then a right+click provides visualisation options, as seen in the image below.
Values Panel
The Values panel contains the Trait Value tab and the Sample Data tab, outlined in the sections below.
Trait Value Tab
The Trait Value tab contains information about one or more samples that have been selected in the Curation Samples table (see the above image). The tab will display the source of each sample, the measurement date, its value, and its row and column numbers (X/Y coordinates).
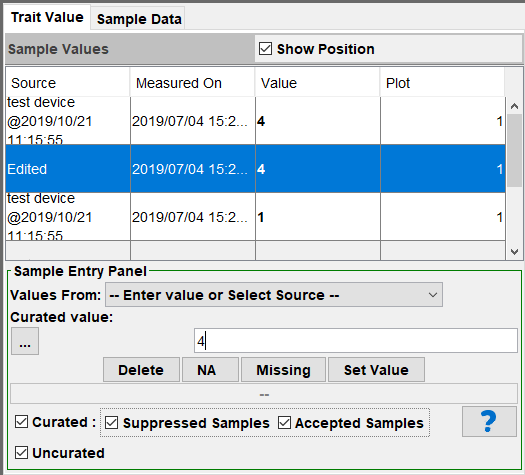
Changes to a value are reflected in the Trait Value tab by the creation of another row called Edited.
UI Element |
Description |
|---|---|
Show Position checkbox |
Displays/hides the plot column for sample values. |
Values From menu |
A dropdown menu that allows for choosing a source of data. This is relevant if there are multiple data sources. |
… button |
Displays buttons that can set the min, max, median, mean, and mode. |
Delete button |
Deletes the values for the selected samples. |
NA button |
Sets the value of the selected samples to Not Applicable. |
Missing button |
Sets the value of the selected samples to Missing. |
Set Value button |
Sets the value for the selected trait samples. You can enter the value into the text field above the button. |
Curated checkbox |
Enables the suppressed and accepted options. |
Suppressed Samples checkbox |
Sets values for suppressed samples. |
Accepted Samples checkbox |
Sets values for accepted samples. |
Uncurated checkbox |
Sets values for uncurated samples. |
|
Opens a window with help instructions for this tab. |

Sample Data Tab
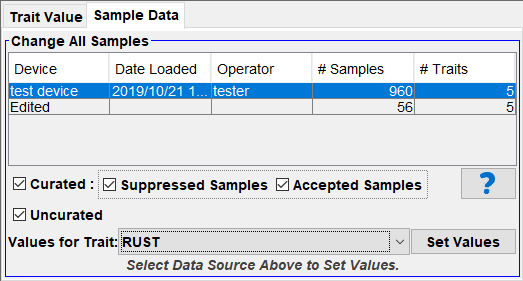
The Sample Data Tab provides information on the data sets that are available for the trial. Each data set will be unique when data has been collected by one or more scorers. For example, the image below shows just one dataset from a user called ‘tester’ and a ‘test device’. Other columns show the date the data was loaded into Trial Manager and the number of samples and traits in the trial.
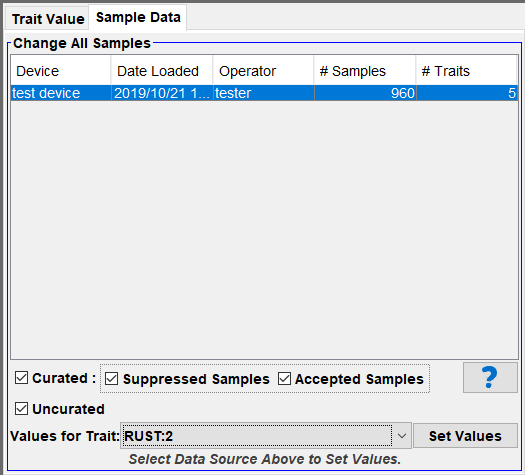
The following options are available in this tab:
UI Element |
Description |
|---|---|
Set Values button |
Sets the collected values for the trial (of the trait selected in the Values for Trait Dropdown menu). |
Values for Trait menu |
A dropdown menu for choosing a trait to set the final values for. |
Curated checkbox |
Enables the suppressed and accepted options. |
Suppressed Samples checkbox |
Sets values for suppressed samples. |
Accepted Samples checkbox |
Sets values for accepted samples. |
Uncurated checkbox |
Sets values for uncurated samples. |
|
Opens a window with help instructions for this tab. |
Curation Samples Panel
Once traits are chosen in the Plot Info & Traits panel, they appear in the Trait Instances table and Curation Samples table, both within the Curation Samples panel. The following sections outline each of these tables.
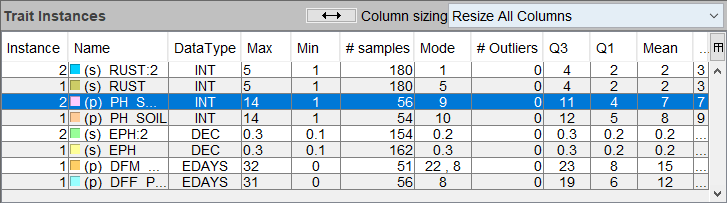
Trait Instances Table
The Trait Instances table displays the traits and trait instances that have been selected in the Plot Info & Trait Instances panel. Each trait and trait instance is listed as a row and accompanied by other information, including the data type, number of samples, and statistics such as the mean of sample values for the trait.
Next to the name of each trait/instance will also contain the notation (s) or (p) to indicate whether the trait is on the plot or subplot level. You can select columns to sort traits, such as ordering traits by the number of scored samples. See the image below and the accompanying table for more information on the UI elements of the table.
UI Element |
Description |
|---|---|
|
Resizes columns according to the chosen dropdown option. |
Column Sizing menu |
A dropdown menu that contains options for column sizing. |
|
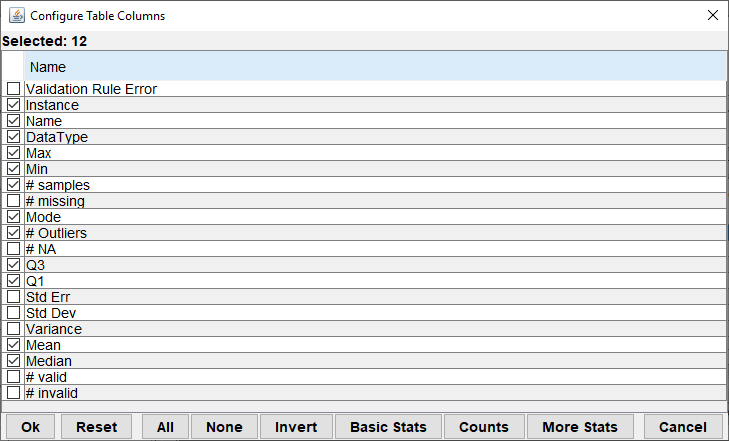
Opens the Configure Table Columns window (as seen in the image below), which provides configuration options for the columns that appear in the Trait Instances table. |


Curation Samples Table
The Curation Samples table displays collected data according to the traits and instances that have been selected as per the Plot Info & Trait Instances panel.
The following image and table provide information on the Curation Samples table and UI elements of the table.
UI Element |
Description |
|---|---|
Hide Inactive Plots checkbox |
Hides all inactive plots. |
Un-Curated checkbox |
Displays un-curated data. |
Only Scored checkbox |
Displays only scored plots and subplots. |
|
Displays a list of tags to filter curation samples by. The button will appear as |
|
Provides options to filter by plot or subplot. The button will appear as |
|
Opens a window with help instructions for this table. |
|
Resizes columns according to options chosen in the dropdown menu. |
Column Sizing menu |
A dropdown menu thatcontains options for column sizing. |


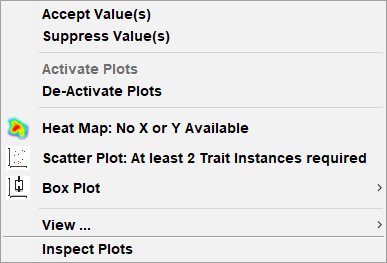
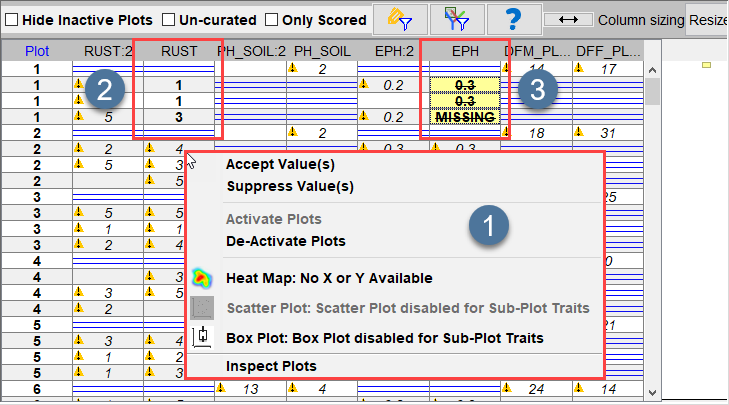
Right+clicking a sample provides further options for the data. The following image and table provide more information on the options:
UI Element |
Description |
|---|---|
Accept Values |
Marks the values as correct. This is important when there are multiple datasets for the trial. |
Suppress Values |
Marks the values incorrect. This is important when there are multiple datasets for the trial. |
Activate Plots |
Activates any de-activated plots. |
Deactivate Plots |
De-activates a plot. |
Heat Map |
Opens the Heat Map window to create a heat map with the selected plots. |
Scatter Plot |
Opens the Scatter Plot window to create a heat map with the selected plots. |
Box Plot |
Opens the Box Plot window to create a box plot with the selected plots. |
View … |
Displays all attachment files associated with the plot or subplot. |
Inspect Plots |
Opens the Plot Inspection window, which provides information on the plots, including measurement values. |
Note
The visualisation options available are explained in more detail later on on this user guide page.
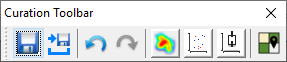
Toolbar
The toolbar provides some options for saving, curating, and visualising the data. You can detach the toolbar from the Main Curation window by clicking+dragging the bar that the Toolbar is attached to. The image and table below provide some information on the options available in the Toolbar:
UI Element |
Description |
|---|---|
|
Saves any curation of the data. Once data has been saved, it will not be possible to use the undo or redo functions. |
|
Opens the Export Curated Data window, which provides options for exporting data and configuring the output of exported data. |
|
Undoes any curation changes made to the dataset. This will be disabled if not applicable. |
|
Redoes any undo action made for curation changes. This will be disabled if not applicable. |
|
Opens the Heat Map window, which provided options for creating a heat map visualisation. |
|
Opens the Scatter Plot window, which provided options for creating a scatter plot visualisation. |
|
Opens the Box Plot window, which provided options for creating a box plot visualisation. |
|
Opens the Field View window, which provides a top-down view of the trial field and other information. |


Curating Measurements
One of the main functions of the Trial Manager plugin and the Curation tool is to curate data collected from the field before it is uploaded to KDDart. Values can be curated in a few ways, as is outlined below.
Tip
You can only curate values permitted by the validation rules of the trait that is being measured.
Single-Selection Curation
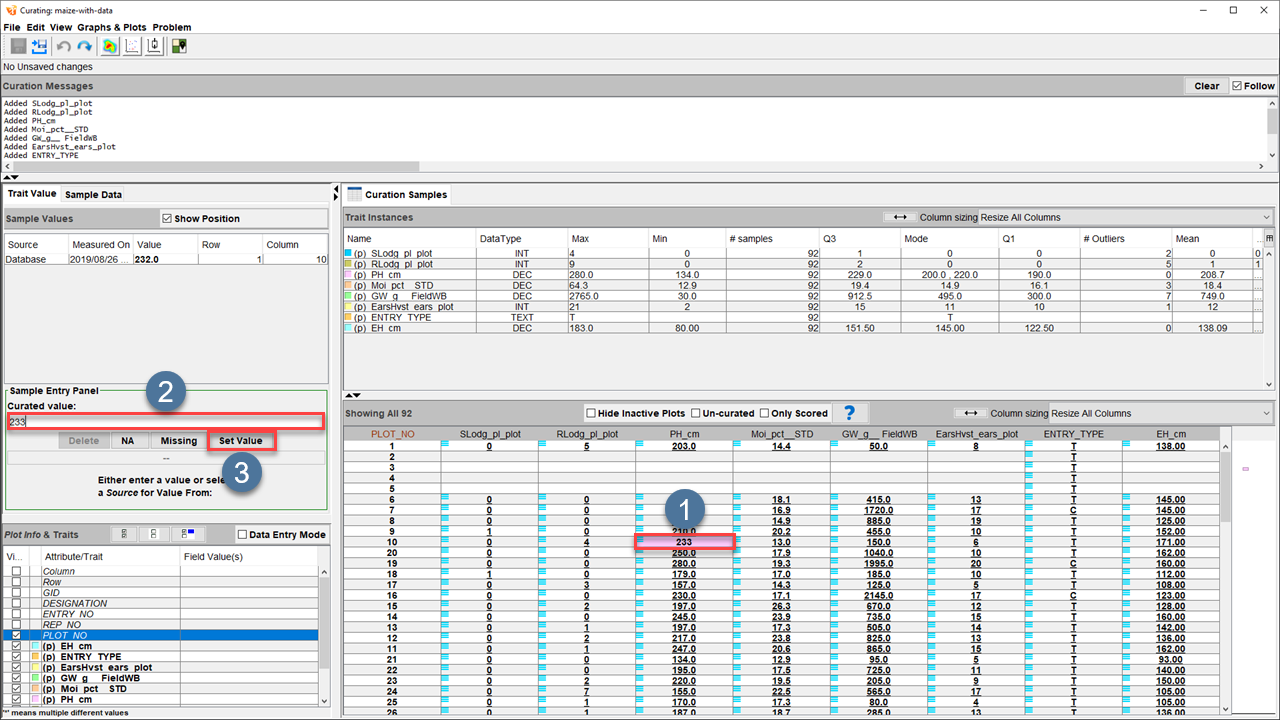
The simplest way to curate trial data is to curate a single value. The example below demonstrates how to curate a single measurement:
Step |
Action |
|---|---|
1. |
Select a single sample from the Curation Samples table. This will display the sample’s information in the Values panel. |
2. |
Enter a new value into the text field at |
3. |
It is permanently set when you select the Set Value button. Each change to a sample will be reflected in the Trait Value tab with a history of all value changes. |
Multi-Selection Curation
The Curation Samples table also allows users to select multiple samples at once. This allows for the curation of multiple samples simultaneously, which makes curation easier and more efficient. Multi-select curation is useful when large numbers of samples need to be modified to have the same value.
Step |
Action |
|---|---|
1. |
Select multiple samples from the Curation Samples table. This will display the sample information in the Values Panel. |
2. |
Enter a new value into the text field at |
3. |
The values are permanently set when you select the Set Value Button. EThe Curation tool will reflect each change to a sample in the Trait Value Tab with a history of all value changes. |
Trial-Wide Curation
You can set the values of specific trait instances across an entire trial. However, you should only do this if you are sure that the correct values exist for that trait instance. The below image example provides an example of how to use this function:
Step |
Action |
|---|---|
1. |
Navigate to the Sample Data tab in the Value panel. |
2. |
Select one of the datasets listed in the tab. The example above shows the datasets called test device and Edited. |
3. |
Choose any of the checkboxes to include setting the values that are to be set. |
4. |
Use the Values for Trait dropdown menu to select a trait instance such as Rust in the example above. |
5. |
Select the Set Value button to confirm setting the values of that trait instance. |
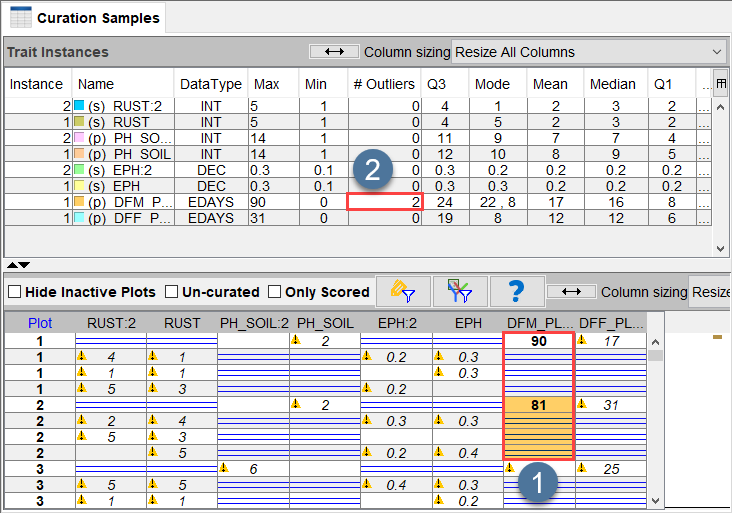
Showing Outliers
The Curation tool makes it possible to see any outliers that have occurred when scoring. Outliers are any data measurement that shows extreme deviation from a data set and indicates that the data collector incorrectly entered data. A part of the overall curation process is to remove these outliers.
Outliers can be found in the Curation Sample panel. See the below image and instructions on finding and removing outliers from a dataset:
Step |
Action |
|---|---|
1. |
View the samples of the Curation Samples table. The above image shows two samples where the values have been accepted but are far outside the normal range for that trait (at |
2. |
See the Outliers column at |
Accepting/Suppressing Measurements
A part of the curation process is to either accept or suppress measurements for each sample. This is important if there are multiple datasets for the same trial that do not match.
An example of this would be if two users (who have scored the same trial) collected data imported into Trial Manager, and there was a sample that was scored differently by each user. One of the samples would need to be suppressed, and the other would need to be accepted. You could find this out by going back into the field and checking the measurement if possible.
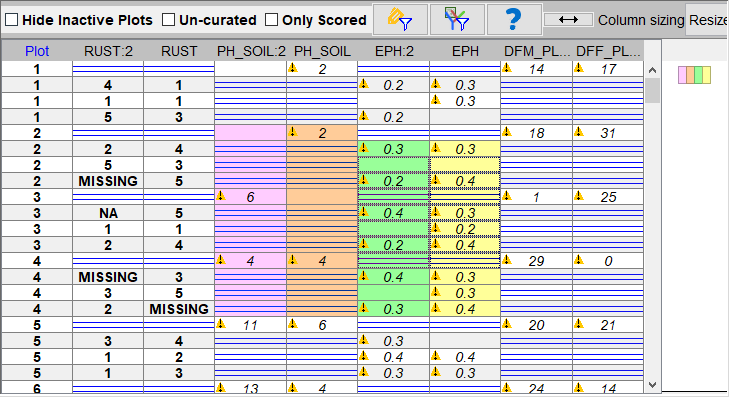
The image and instructions below provide some information on how to accept and suppress samples:
Step |
Action |
|---|---|
1. |
Right+click a sample and either select the Accept Value(s) or Suppress Value(s) option to accept or suppress the value (as seen in |
2. |
Either option will open a small window that will ask for confirmation. |
3. |
Accepted values will be bold and not have the warning icon next to them - such as the values for the Rust trait at |
Saving & Exporting Curated Data
After curating data, it will need to be saved so that any changes are kept. The data can then also be exported if need be. See the following instructions on how to save and export curated data:
Step |
Action |
|---|---|
1. |
Select the Save button |
2. |
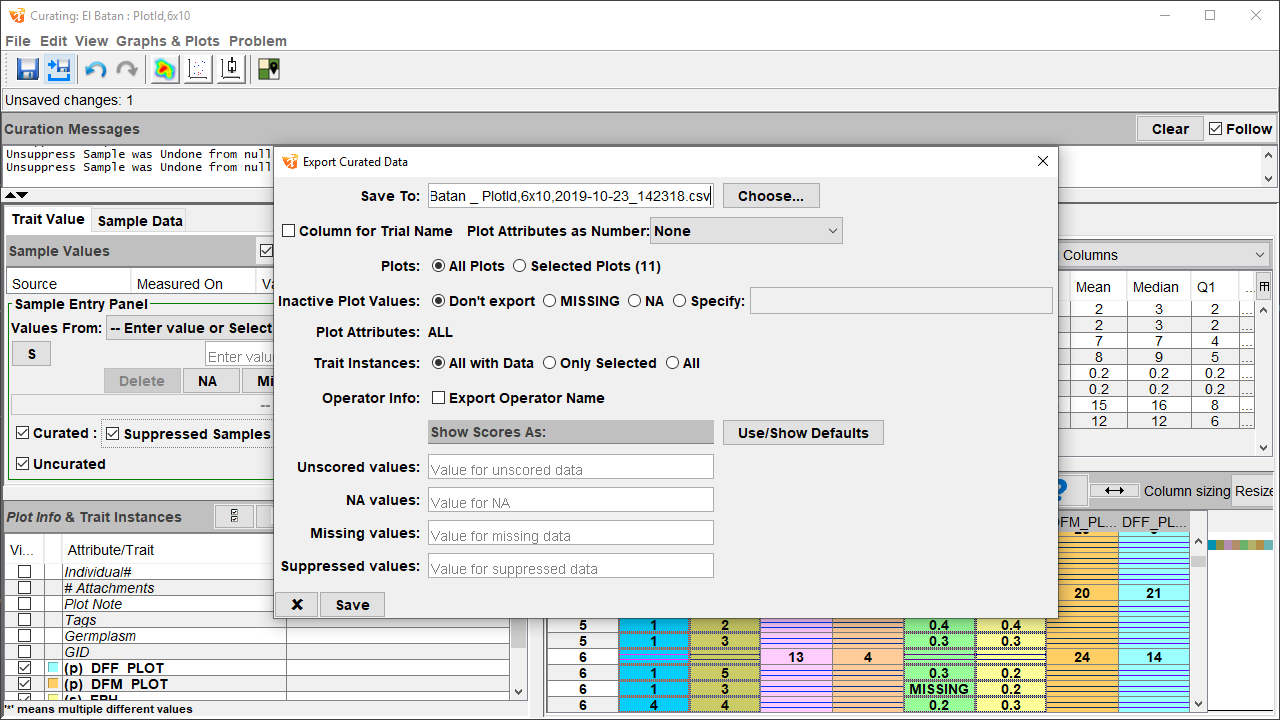
You can export data after saving. Select the Export button |
3. |
Configure the export as per the options provided. This included choosing a location to export the data to, whether to export all or just selected plots, and whether to export the operator name. |
4. |
Select the Save button at the bottom of the window to finalise the export. |
Overview
The Overview window provides information on the status of each plot, such as whether the data is curated. The information is displayed on a per-trait basis.
Note
Please note that the Overview window is currently disabled and is undergoing revision.
Field View
The Field View window provides a top-down view of the trial field with information on plots and allows for selecting samples. You can open it by selecting the Field View button  from the Main Curation window.
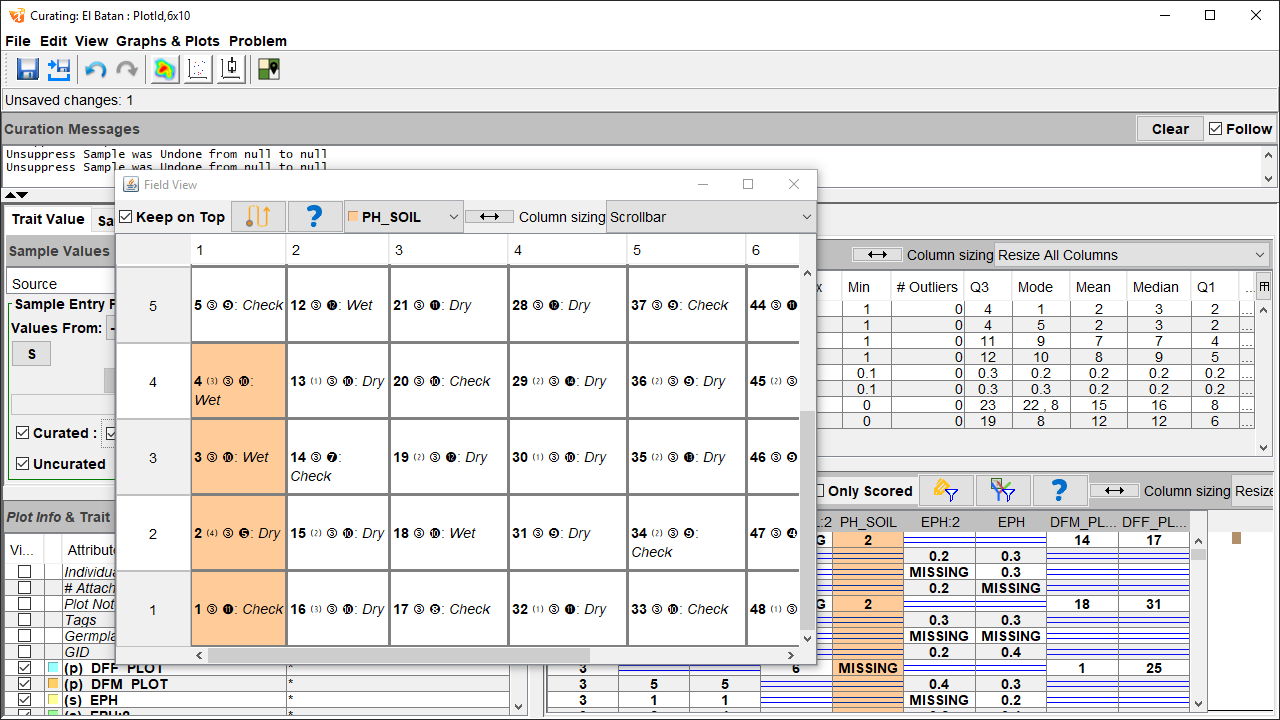
The image below demonstrates how the selection of plots in Field view will also select the associated samples from the Curation Samples table in the Main Curation window. The trait chosen from the dropdown menu in the Field View window will also determine what samples are selected. For example, if the trait PH_Soil is chosen in the Field View window and plots are selected, then the PH_Soil samples for those plots are the ones that you will select in the Curation Samples table.
The image and table below provide an example of the Field View window and its UI elements.
UI Element |
Description |
|---|---|
|
Opens the Collection Path Window, which provides options for how to collect data whilst in the field. This button will look different depending on the point-of-origin and traversal pattern chosen, e.g. |
|
Opens a window with help instructions for Field View. |
Trait Menu |
A dropdown menu, which allows the user to select traits for selection. |
|
Resizes columns according to the chosen dropdown option. |
Column Sizing Menu |
A dropdown menu that contains options for column sizing. |
Plots |
As Field View provides a top-down view of a trial field, each plot is shown in a grid. See the image and table below for more information on plots. |


UI Element |
Description |
|---|---|
Plot Number |
The plot number within the trial. The example in the image above shows that this plot is number 29. |
⑴ |
The number of plot-level attachments. Please note that this does not include subplot-level attachments. |
① Subplot Number |
The number of subplots within the plot. The example shows that plot 29 contains three subplots. |
❶ Tags Number |
The number of tags for this plot. Plot 29 in the example above has 14 tags applied. |
Plot Type |
Displays the plot type, which is a plot attribute. For example, the plot type of plot 29 is Dry. |
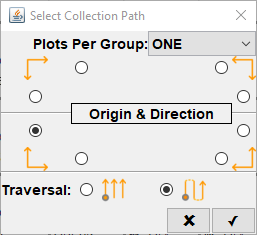
Collection Path
The collection path determines how a KDSmart user will collect data whilst in the field. The following table provides information on the options available for the collection path:
Option |
Description |
|---|---|
Plots per Group |
Determines how many plots are scored at once. For example, you can use this if you want to decide whether to score data from only plots on their left as you walk through a field, or to score plots on both your left and right. |
Origin & Direction |
Sets the corner of the field that the scoring will start from, and the scorer’s direction will move in. |
Traversal |
Establishes the pattern on traversal that the user will take through the field, either a serpentine or straight traversal pattern. |
Select the Confirm button  to confirm the collection path options.
Note
The collection path options set here will carry over to the KDSmart application when you transfer the trial for scoring. However, you can also change collection path options in KDSmart.
Visualisation Tools
The Curation tool provides options for various data visualisations. You can create heat maps, box plots, and scatter plots with scored data and compare samples with a plot identification visualisation.
You can generate visualisations from the Trait Instance table, Curation Sample table (by selecting samples and then right-clicking, then choosing a visualisation option), or from the toolbar at the top of the Curation Main window.
Heat Map
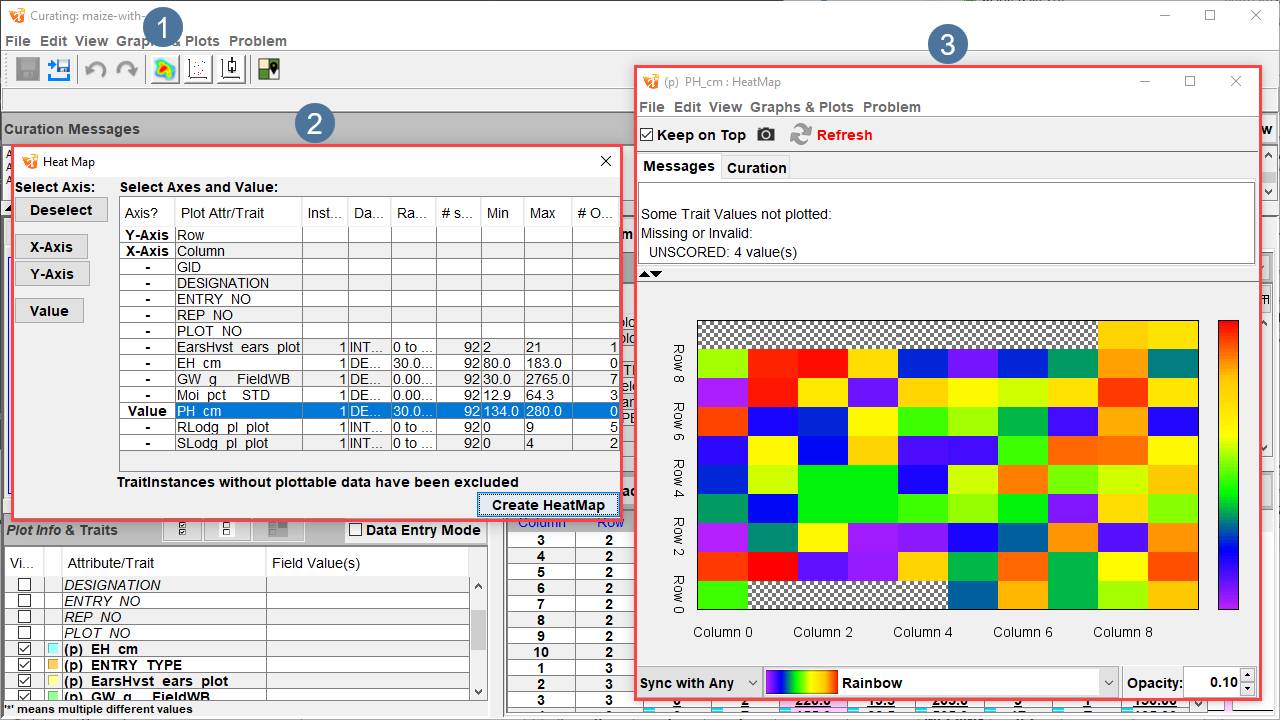
The Curation Tool can create a heat map representing the experiment data that is displayed in varying colours. The image and instructions below provide information on how to create a heat map from scored data.
Step |
Action |
|---|---|
1. |
From the toolbar in the Curation Main window (at |
2. |
Select a row and then the Axis buttons on the left of the window to set the X and Y axes of the heat map. Rows and columns are automatically set as either the X or Y, but if you need to change those values, select each row and then the Deselect button so that you can reset each row. |
3. |
Select a row for the value to be represented in the heat map, and then select the Value button to set the value. The example above shows the selection of the PH trait. |
4. |
Select the Generate Heat Map button to create the heat map, which will open at |
Note
You can only create an appropriate heat map from an X/Y trial. Plot ID trials do not have the information necessary to create the map.
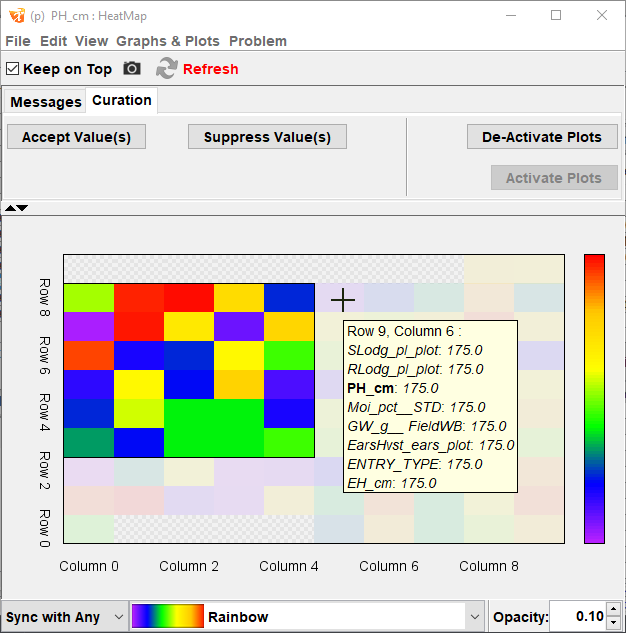
UI Element |
Description |
|---|---|
Camera button |
Provides options for saving the heat map as an image. |
Refresh button |
Refreshes data that may have changed in the heat map. |
Messages tab |
Displays information on any changes to the heat map. |
Curation tab |
Provides options for accepting/suppressing values and activating/deactivating plots. |
Accept Values button |
Accepts the values for any selected plots. |
Suppress Values button |
Suppresses the values for any selected plots. |
Deactivate Plots button |
Deactivates any selected plots that are currently active. |
Activate Plots button |
Activates any selected plots that are currently deactivated. |
Plots |
Each plot in the heat map is a square with a colour representing the trait value. You can display plot information by hovering over the plot with the mouse (as seen in the example image). In addition, multiple plots are selectable by clicking+dragging over one or more plots. |
Sync menu |
A dropdown menu that provides options for syncing changed values from the Curation Tool. |
Colour menu |
A dropdown menu that provides colour scheme options for the heat map. The colour scheme in the image above is set to Rainbow. |
Opacity field |
A text field that allows for the configuration of opacity levels of the heat map colour values. A number can be entered into the field and adjusted with the up and down arrows. |
Scatter Plot
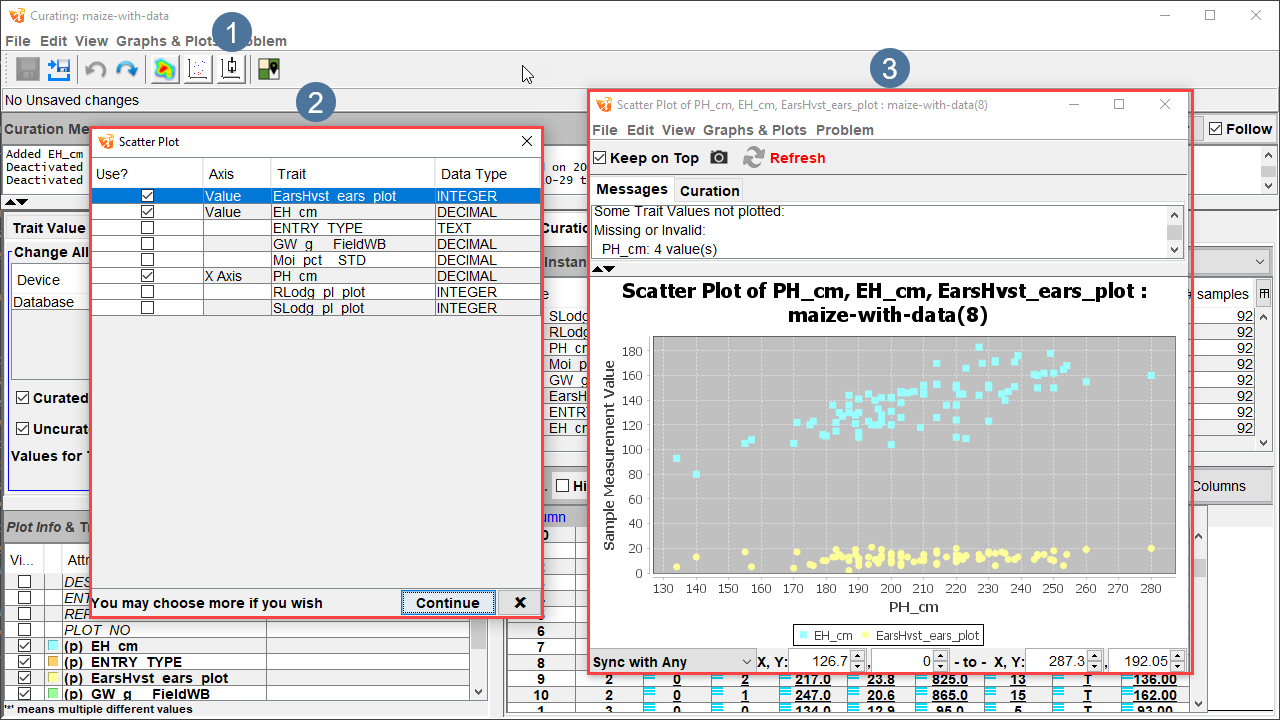
The Curation tool also can create a scatter plot to represent scored data. The image and instructions below provide more information about how to create and use the scatter plot.
Step |
Action |
|---|---|
1. |
From the Toolbar in the Curation Main window (at |
2. |
Each row is a trait that is in the trial. Select a checkbox to set that trait as the X-axis. Deselect that checkbox to remove that trait as an axis. The example above has the PH_cm trait set as the X-axis. |
3. |
To set traits to be represented in the scatter plot, continue selecting the relevant checkboxes. Then, one or more traits need to be set as the value to be displayed. For example, the EH_cm and EarsHvst_ears_plot traits are set as the values represented in the scatter plot above. |
4. |
Select the Continue button to create the scatter plot, which will open at |
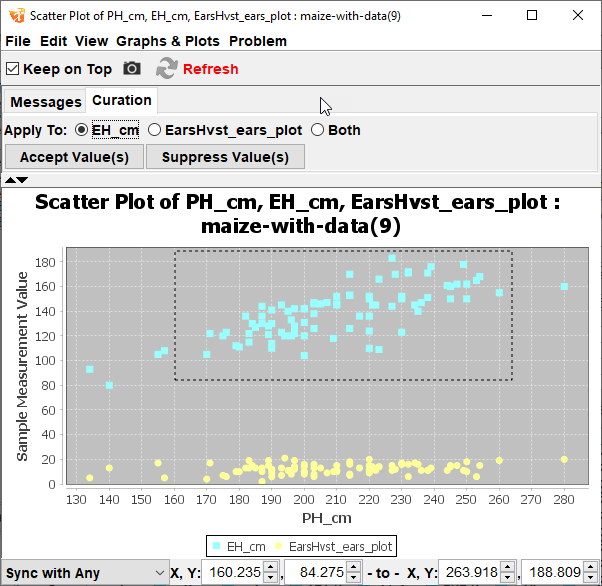
Once the scatter plot has been created, see the image and table below for more information on using the scatter plot.
UI Element |
Description |
|---|---|
Camera button |
Provides options for saving the scatter plot as an image. |
Refresh button |
Refreshes data that may have changed in the |
Messages tab |
Displays information on any changes to the scatter plot. |
Curation tab |
Provides options for accepting/suppressing values. |
Apply To options |
Radio buttons that allow for selecting one or all traits are represented as values in the scatter plot. |
Accept Values button |
Accepts the values for any selected samples. |
Suppress Values button |
Suppresses the values for any selected samples. |
Samples |
Each sample in the scatter plot is a coloured square representing the trait according to the key. In the example above, EH_cm is light blue, and EarsHvst_ears_plot is yellow. Clicking+dragging can select values in the scatter plot. |
Sync menu |
A dropdown menu that provides options for syncing changed values from the Curation Tool. |
Colour menu |
A dropdown menu that provides colour scheme options for the heat map. The colour scheme in the image above is set to Rainbow. |
Opacity field |
A text field that allows for the configuration of opacity levels of the heat map colour values. A number can be entered into the field and adjusted with the up and down arrows. |
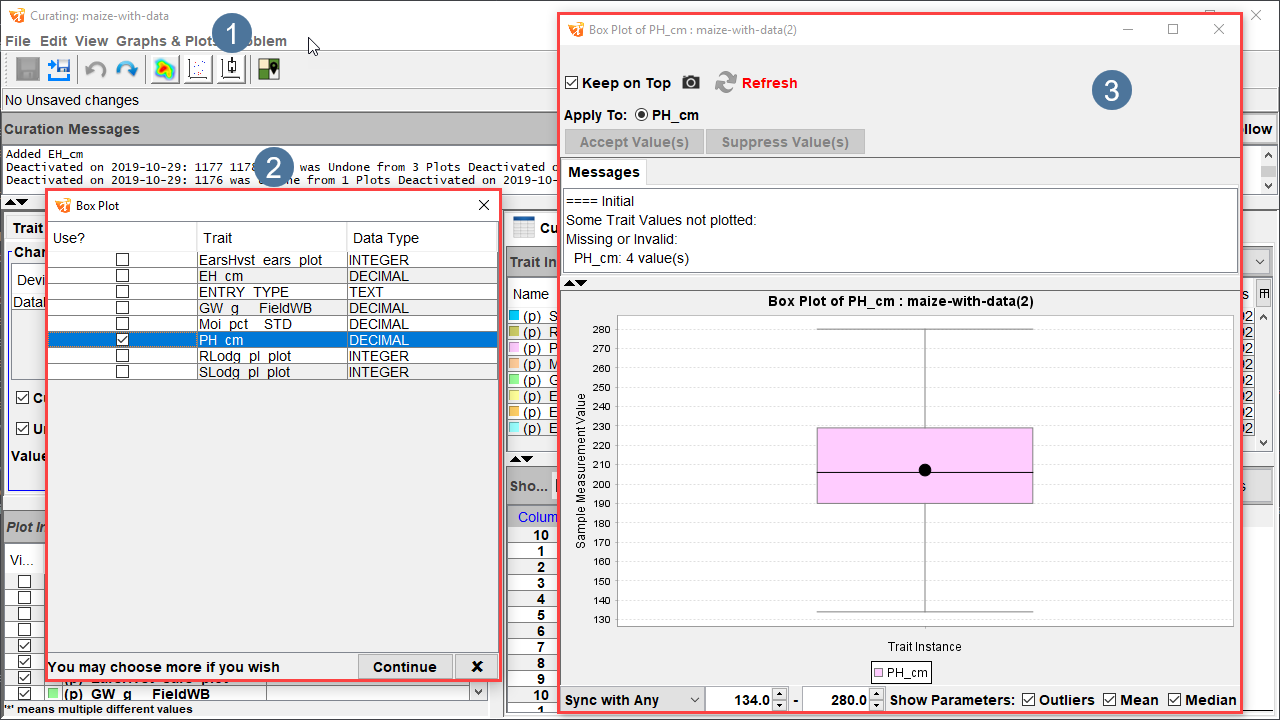
Box Plot
You can also create a box plot with the Curation tool. The image and instructions below provide more information about how to create and use the box plot.
Step |
Action |
|---|---|
1. |
From the toolbar in the Curation Main window (at |
2. |
Each trait is a row within the Box Plot Configuration window. Select one or more checkboxes to display that trait in the box plot. |
3. |
Select the Continue button to create the box plot, which will open at |
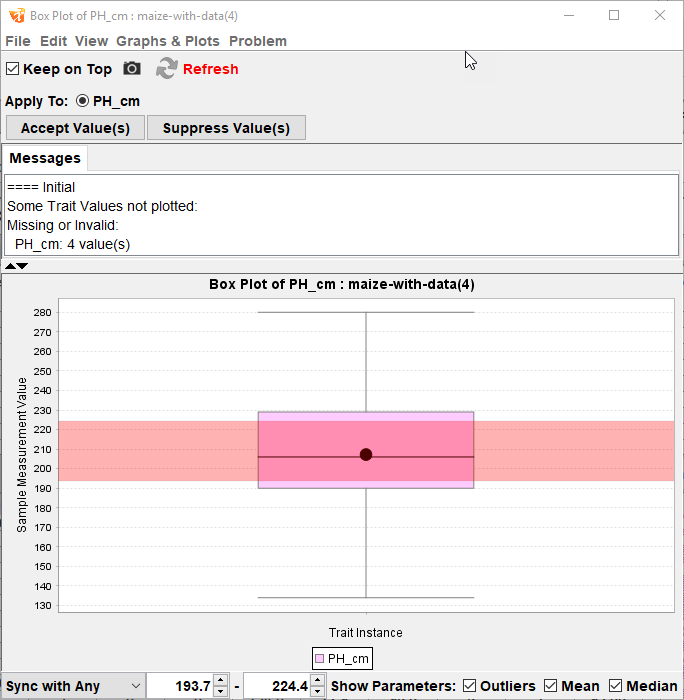
Once the box plot has been created, see the image and table below for more information on using the box plot.
UI Element |
Description |
|---|---|
Camera button |
Provides options for saving the box plot as an image. |
Refresh button |
Refreshes data that may have been changed. |
Messages tab |
Displays information on any changes to the box plot. |
Accept Values button |
Accepts the values for any selected samples. |
Suppress Values button |
Suppresses the values for any selected samples. |
Samples |
Samples are grouped into a box plot which demonstrates the data in quartiles, the box being Q2 and Q3. You can select samples by clicking+dragging over an area of the box plot. |
Sync menu |
A dropdown menu that provides options for syncing changed values from the Curation tool. |
Show Parameters options |
Checkboxes for displaying the outliers, mean, and median of the data. |