Tutorial 4 - KDXplore Curation
The Trial Manager Plug-in in KDXplore contains the Curate tool which enables the user to curate data that has been loaded to KDXplore e.g. changing values of trait instances. The previous tutorial demonstrated how to exchange data from a KDSmart device into KDXplore. By the end of this tutorial, you will be able to open data in KDXplore, curate it, and then upload it to the database.
The objectives of this tutorial are to:
- Open a trial with the curation tool;
- Be able to understand and navigate the curation window;
- Perform a simple, single-selection curation;
- Visualise data; and
- Load the curated data into the KDDart database.
Curation is the aspect of Trial Manager that allows for exploration, visualisation and Quality Control (QC)/Quality Assurance (QA) checking of phenotypic data. Entering curation with a new dataset, the aim is to assess data and either accept values from a device as quality information, or to correct values potentially using another data source. This can also be done by editing values manually. The result of curation is phenotypic data that has been pushed to the offline database of KDXplore as known values for the selected trial and for later export if wished.
Table of Contents
Note
Select any heading to expand/display  or contract
  the section.
Step 1 - Opening a Trial in Curation
To work with any trial in curation, it will first need to be opened in the program. To open a trial in Curation, open the KDXPlore program, and then select the Trial Manager Plug-in to open it. After this is opened, see the following instructions for how to access Curation:
Follow the steps below to access Curation:
| Step | Action |
|---|---|
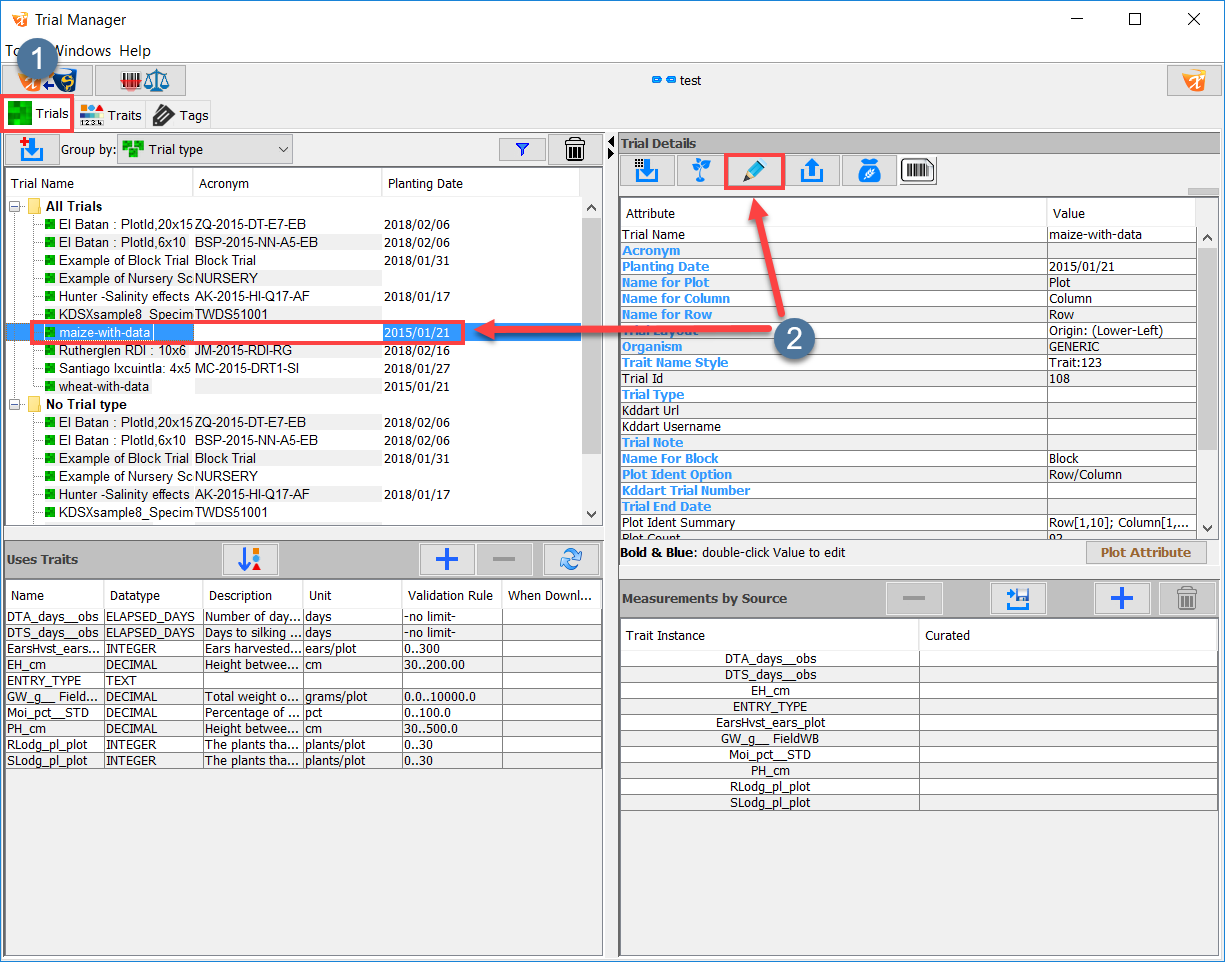
| 1. | Curation can be located by entering the Trials Tab of Trial Manager at  . . |
| 2. | Select a trial by clicking on it to display the trial information. |
| 3. | Either double-click on the trial or select the Edit Current Trial button at  to open the Curation window. to open the Curation window. |
Note
For instructions on how to export scored Data from KDSmart, see the Step 6 - Transferring a Scored Trial to KDXplore section in the previous trial. For help with taking this scored trial from Google Drive to KDXplore so that it can be curated, see the Loading Trials from Google Drive section on the first KDXplore tutorial.
Step 2 - Understanding the Curation Window
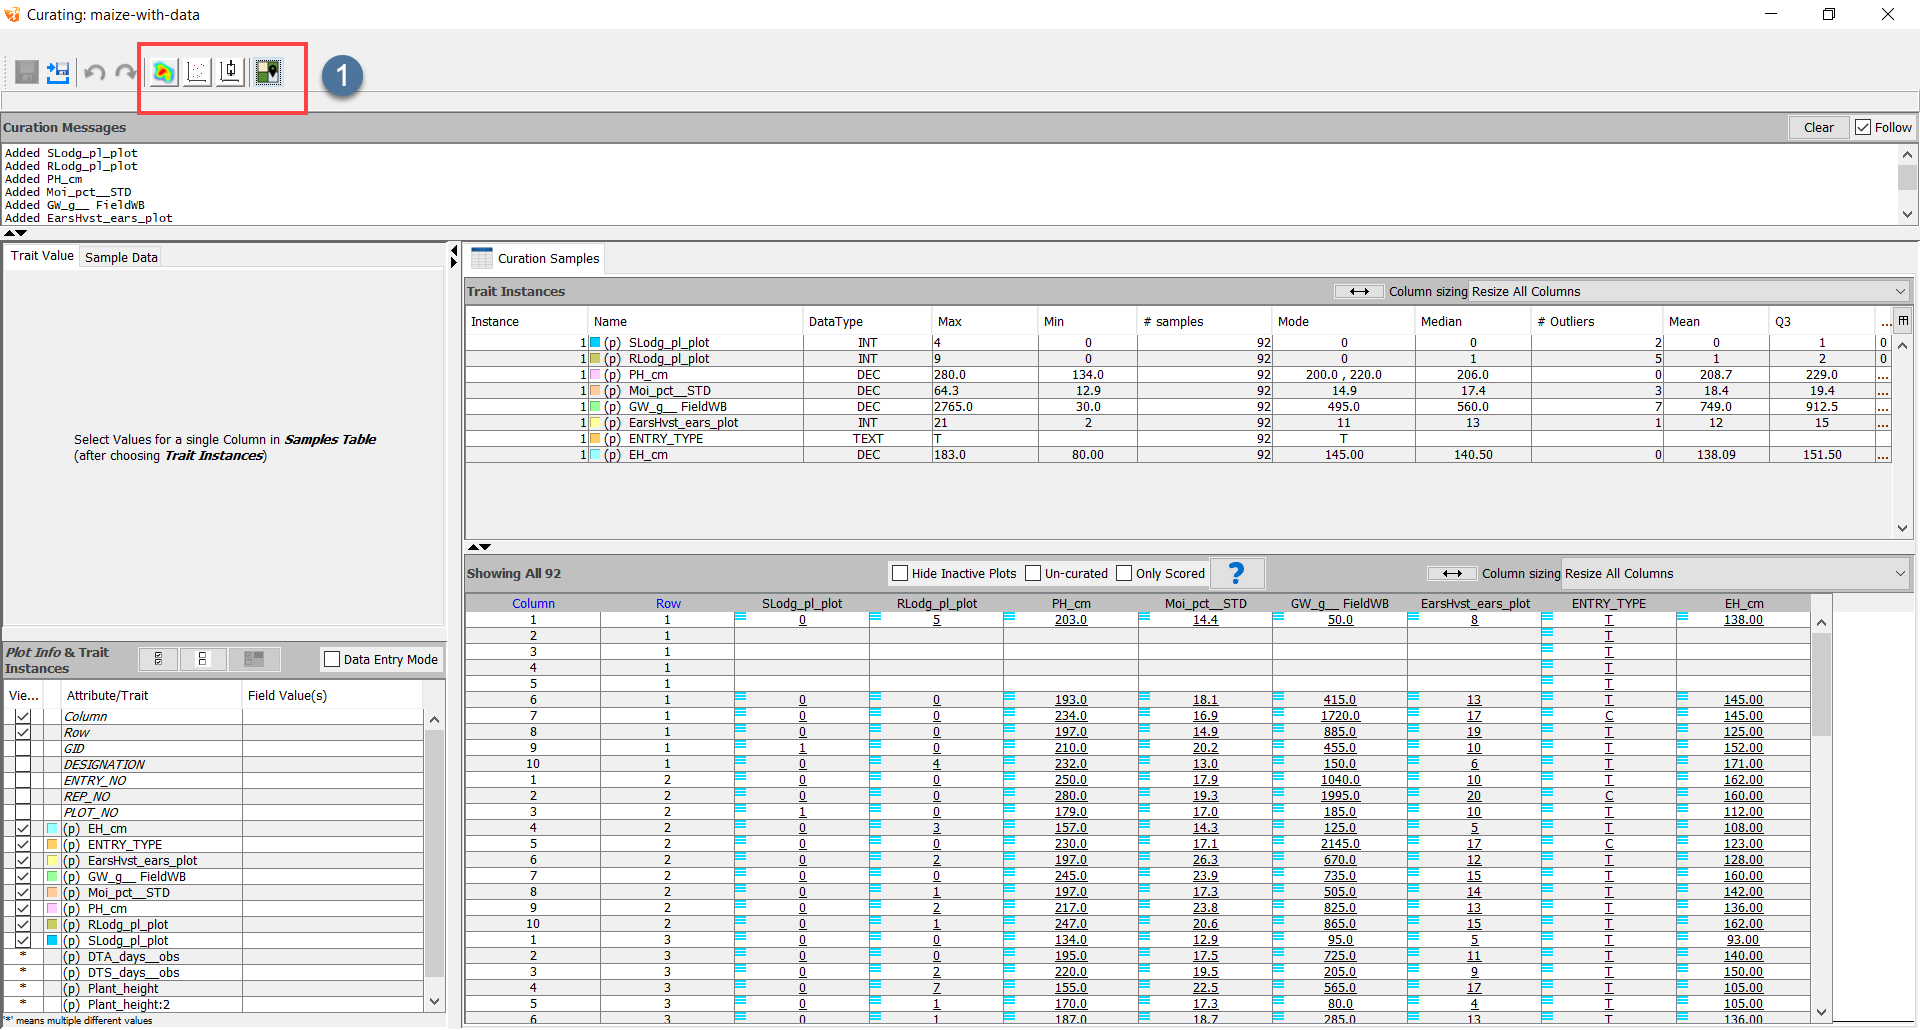
There are many aspects to the Curation tool that is only relevant to advanced users, but the following image will provide an overview of the various panels in Curation.
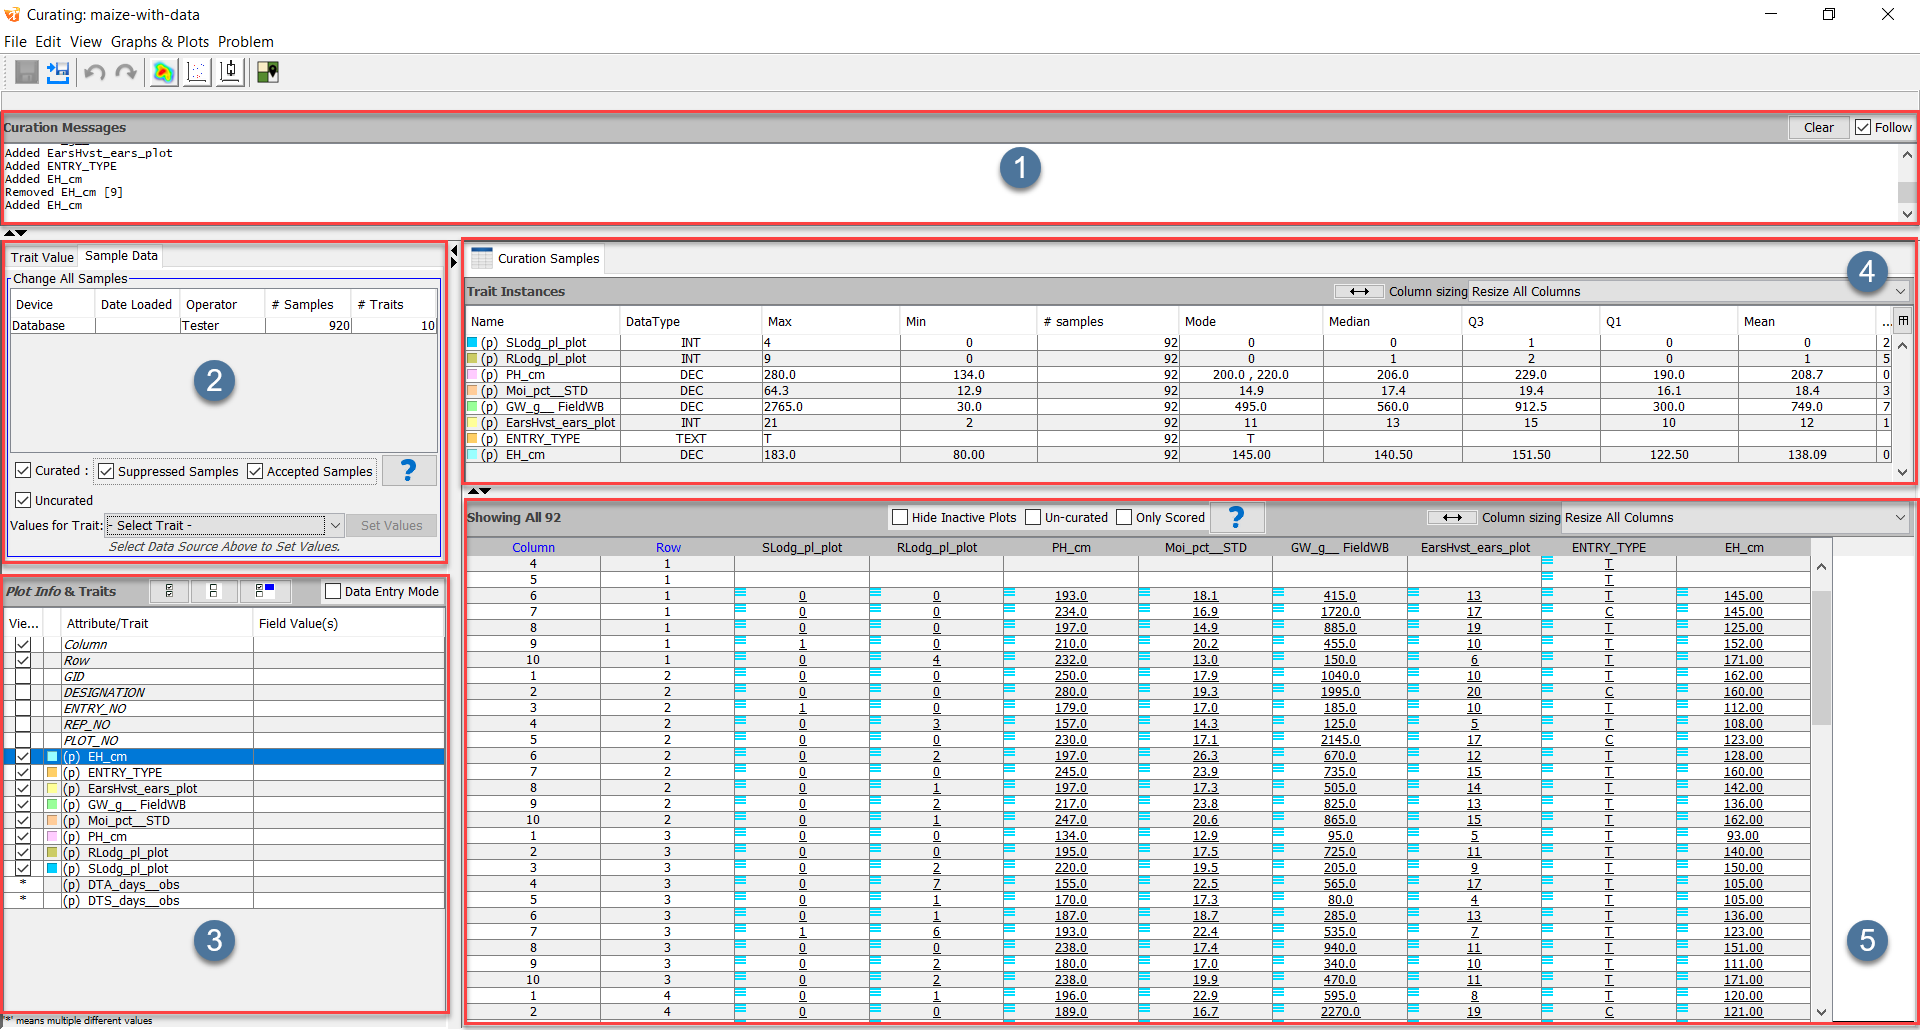
- Curation Messages panel which displays information and messages about events that are occurring in the Curation window.
- Values panel displays information on selected sample values and allows for the editing of values.
 Plot Info & Traits panel lists all traits that are in the trial and contains checkboxes that are used to select traits that can be used in curation.
- The Curation Samples panel displays all information on the selected traits and samples within two tables:
 Trait Instances table lists all selected traits that are included in the trial. There is a colour associated with each trait instance which remains consistent across visualisation tools and highlighting.
 Curation Samples table displays all sample measurements from selected traits.
Note
The full guide for using curation can be found at Curation .
Step 3 - Curating Data
One of the primary functions of the Trial Manager Plug-in is to curate data that is collected from the field before it’s uploaded to KDDart. Values can be curated in several different ways in KDXplore. Once a value is selected, typing a value will immediately fill the cells and this must be confirmed by pressing the Enter key. Values can only be curated to values included by their validation rules, E.g. for EH_CM with a validation rule of (30...200). KDXplore will not let the user choose values that are below 30 or above 200. Simple statistics can be displayed when there are multiple sample sources for the selected measurements. These statistics are displayed in the Trait Values panel.
This tutorial will focus on a simple example of curation to give users some experience in using the Curation tool.
Single-Selection Curation
The simplest way to curate trial data is to curate a single value. The following example demonstrates how to curate a single measurement.
Curating a single measurement can be done by:
| Step | Action |
|---|---|
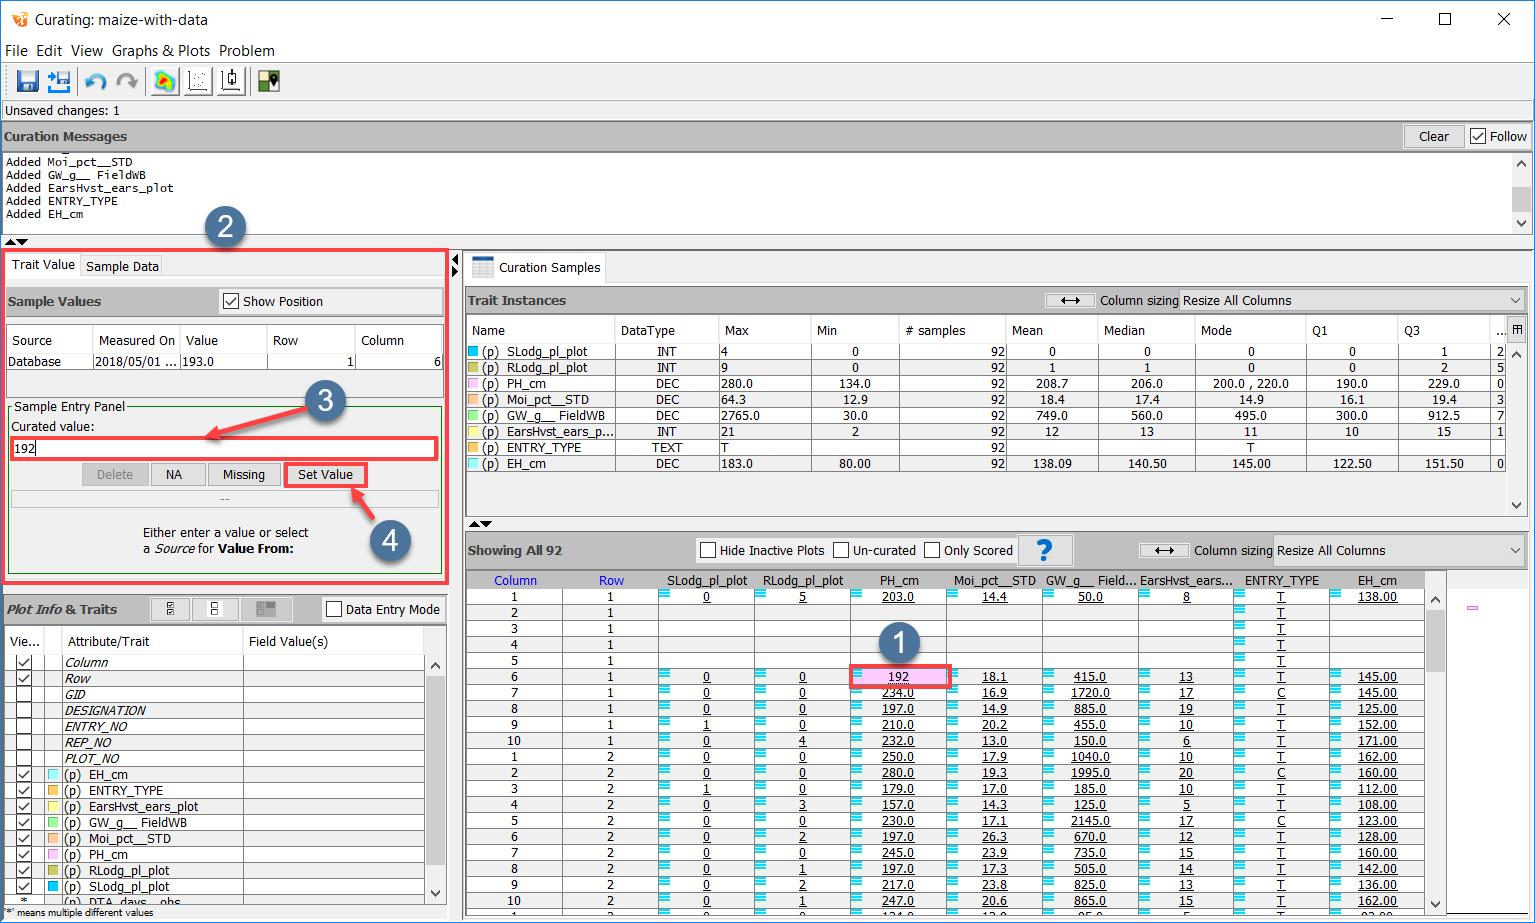
| 1. | Select a single measurement such as the one at . This will display the measurement information in the Values panel at . |
| 2. | Enter the new value into the text-field at . As this value is added, the corresponding value in the Trait Instances panel will also change in real time. |
| 3. | It will not be set permanently until the Set Value button at is selected. |
All previous changes and edits are listed in the Values panel as seen in the following image:
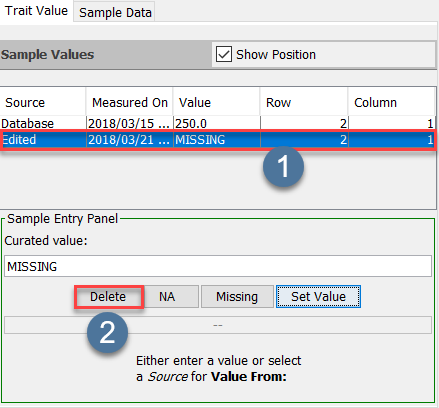
If the user would like to make a change to a previous edit, then they can choose the section and edit it e.g. If a value is set to missing and then the curation is saved, there is no option to undo the changes in values. In this situation, the user can select the edit such as , and then delete the change (at ) which will revert the sample value to its original value.
Note
Multi-Selection curation allows the user to curate multiple selections at once by clicking & dragging across multiple value to select them, and then entering a value. This is explained in the full guide at Multi Selection Curation along with trial-wide curation.
Step 4 - Data Visualisation
The Curation tool provides users the ability to generate various data visualisations with trial data. The visualisations that can be created are highly customisable and can be exported as separate files or printed. There are several types of data visualisations that can be created:
- Heat map;
- Scatter plot;
- Box plot; and
- Field layout.
The purpose of this section of the tutorial is to provide an introduction to the visualisations that can be created. For this tutorial, a basic heat map is created and then exported as an image. The following image and instructions will demonstrate how to do this:
| Step | Action |
|---|---|
| 1. | Open the Curation tool within the Trial Manager Plug-in with a trial that contains data that can be visualised. The ‘maize-with-data’ trial has been opened in the example. |
| 2. | The area at in the above image contains the buttons for the various visualisation tools. Select the  icon to open the Heat Map creation tool as seen in the following image. icon to open the Heat Map creation tool as seen in the following image. |
| Step | Action |
|---|---|
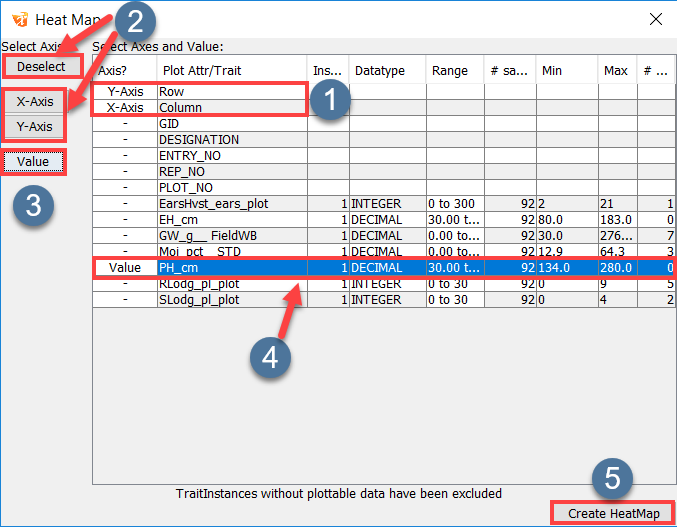
| 1. | Selecting the icon will open the Heat Map tool in the above image. The area in shows that the X-Axis and Y-Axis of the Heat Map is the plot attributes Row and Column. |
| 2. | These can be changed by choosing the Deselect button at on any plot attribute already selected as a for either axes and then selecting the X-Axis and Y-Axis buttons (also at ) for any plot attribute that need to be assigned to either axes. |
| 3. | Choose a trait that needs to be set as the value that is to be visualised in the Heat Map. The selection at indicates that the trait PH_cm is set as the value to be visualised. Another trait can be chosen by selecting the trait and then the selecting the Value button at . |
| 4. | Select the Generate Heat Map button to create the Heat Map as seen in the following image. |
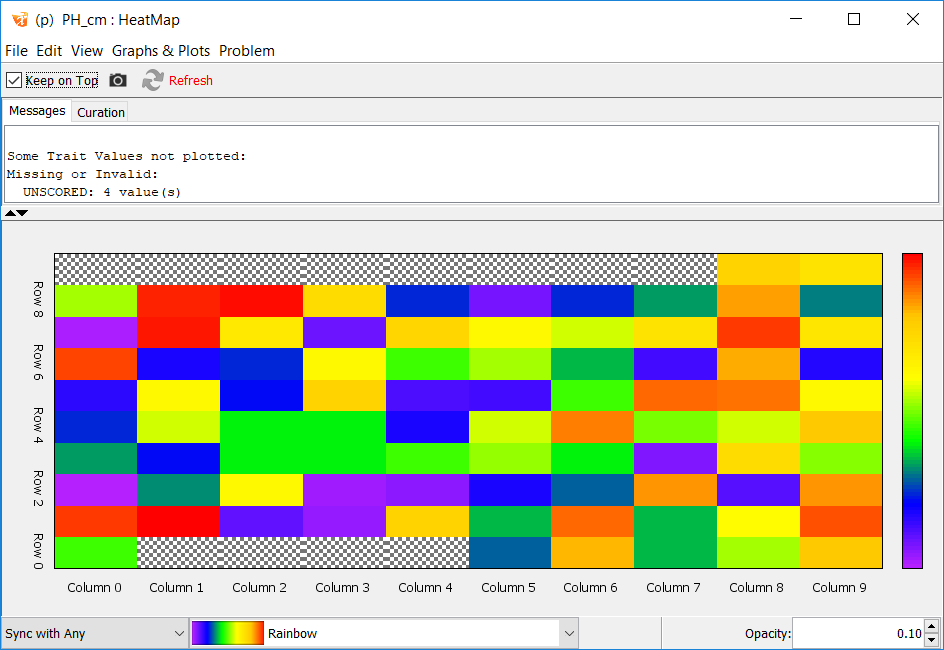
The following animation demonstrates the above steps with a short clip:
Once the Heat Map has been created, it can be saved as an image. This can be done by selecting the  icon, and then selecting a save location for the image.
Tip
Once this has been done, try creating other visualisations to see how they work. For more information about data visualisations, consult the full KDXplore Data Visualisation Help Guide section.
Step 5 - Where to Store Curated Data
Curated data can be moved from Trial Manager in several ways. A brief explanation of these methods will follow.
Upload to KDDart Database
The most secure way to store data is to upload it directly to the KDDart database. See Training Sample Data for database access. The following image outlines how to do that:
| Step | Action |
|---|---|
| 1. | Select a trial that to upload to the database such as the one at . try this with a trait as well. |
| 2. | Select the Upload  icon at . If the upload is successful, then a confirmation message is displayed. icon at . If the upload is successful, then a confirmation message is displayed. |
Export as a File
Another method of saving and moving data is to export it as a file. The following image and steps outline how to do this:
| Step | Action |
|---|---|
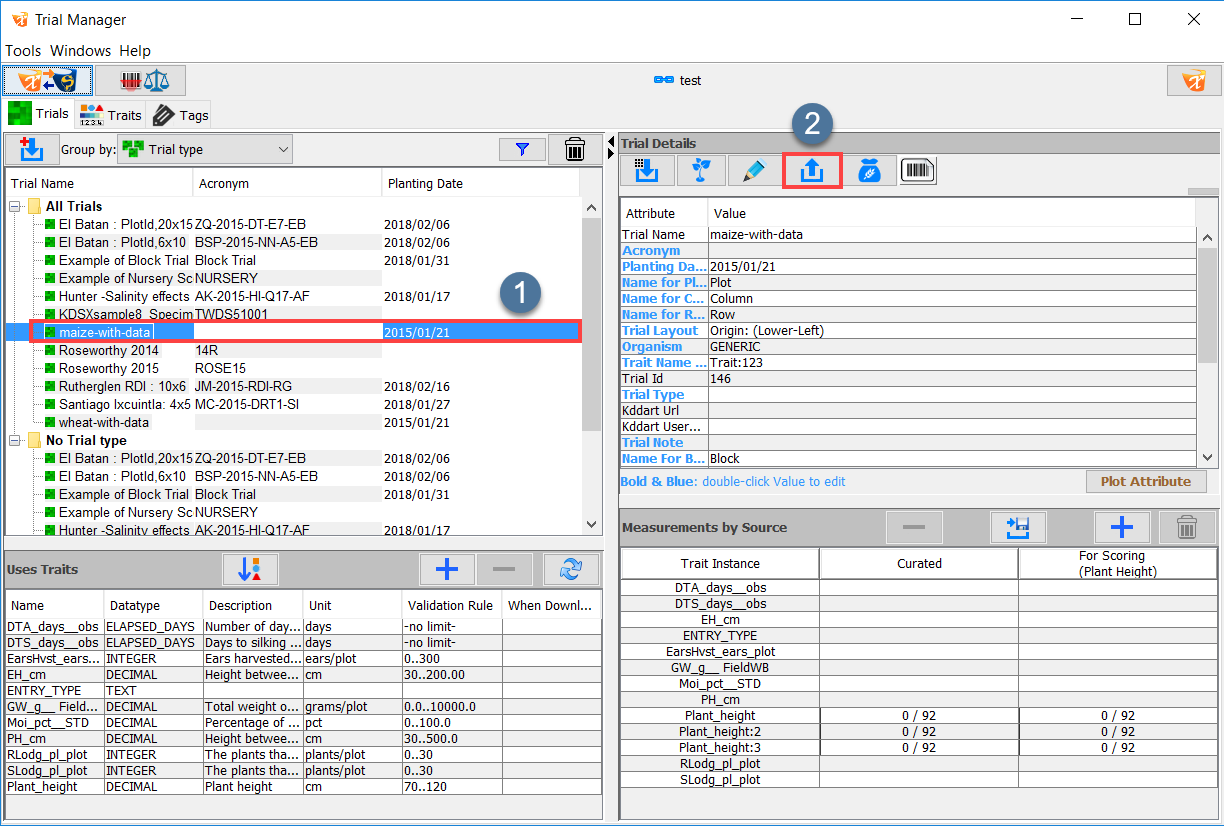
| 1. | Select a trial to export such as the one at |
| 2. | Choose a scoring set to export. Only one can be exported at a time. In this tutorial, the scoring set at has been selected. |
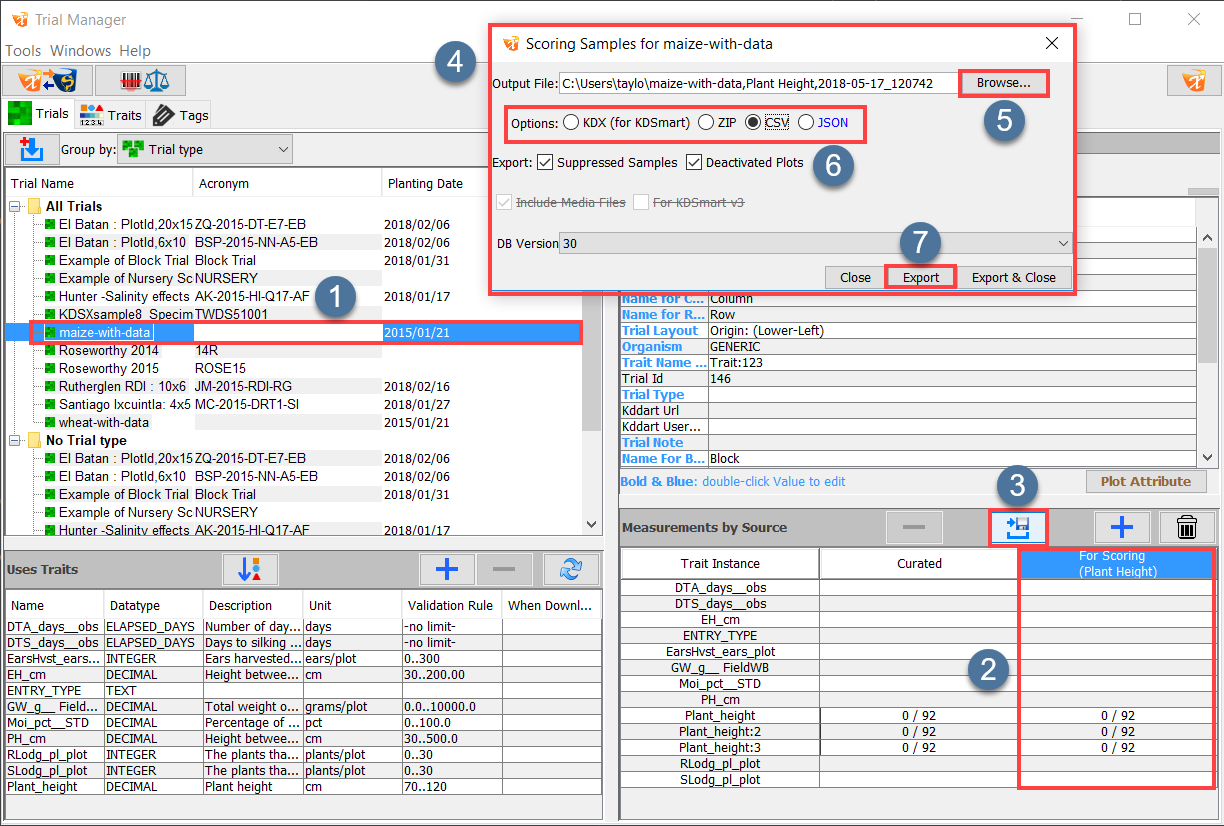
| 3. | Select the Export  icon at to begin the export process. This opens the Export window at . icon at to begin the export process. This opens the Export window at . |
| 4. | The program automatically chooses a name and location for an output file, but this can be changed by editing the text field or selecting the Browse button at . |
| 5. | Choose a file type by selecting one of the options within the area at  . For this tutorial, the CSV file type has been chosen. . For this tutorial, the CSV file type has been chosen. |
| 6. | Select the Export button to finalise the export. The export data from the file then becomes available to be opened. |
The following animation outlines the process of saving this data:
Note
More information on exporting data with this method can be found in the full guide at Export Data.


Summary
Upon completion of this the tutorial, you should now be familiar with:
- Opening a trial in the KDXplore curation tool;
- Understanding and navigating the curation window;
- Performing a simple, single-selection curation;
- Visualised data and downloaded the results; and
- Loading the curated data into a KDDart database.
This tutorial has covered the simplest method of curating data, however it’s recommended that after this method has been practiced, you should consult the full Help Guide to learn how to use other methods at Curating Data in the KDXplore help.
Please also consult the KDSmart/KDXplore Example Resources page to look at other examples that can be opened and examined.