Devices
This page introduces to the following topics:
Topics
Device List
Devices may be viewed in a map or list format.
To view a list of your devices select Devices from the main menu then select Sensors as highlighted at  in the following illustration:
Tip
Note the number of created sensors is displayed to the right of the menu in blue.
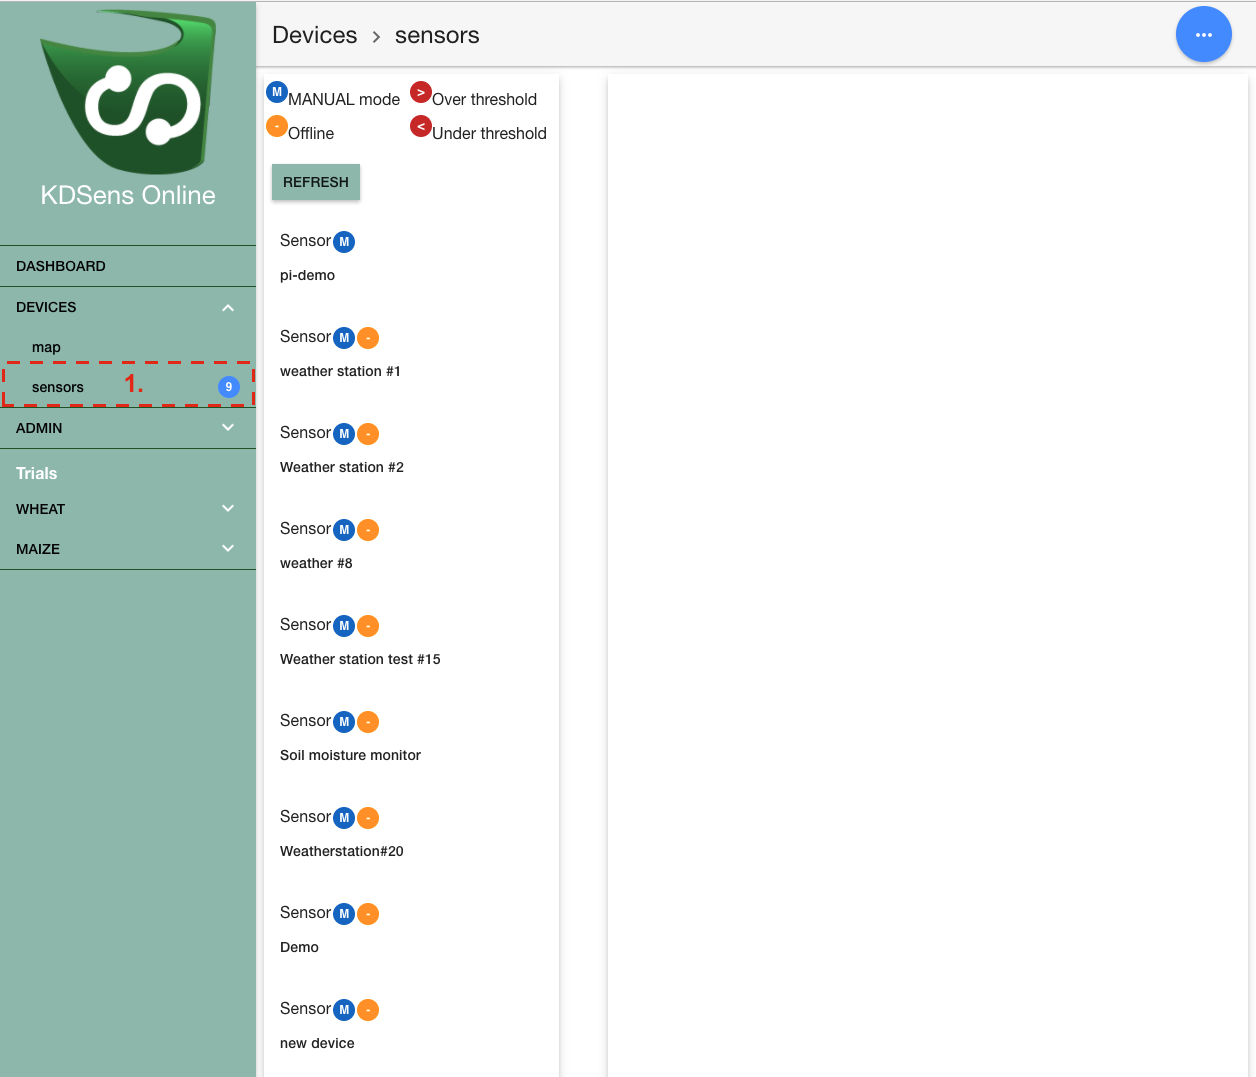
This will direct you to the Device List page where all the created devices in KDSens are visible along with any status tokens which represent particular statuses applied to a device.
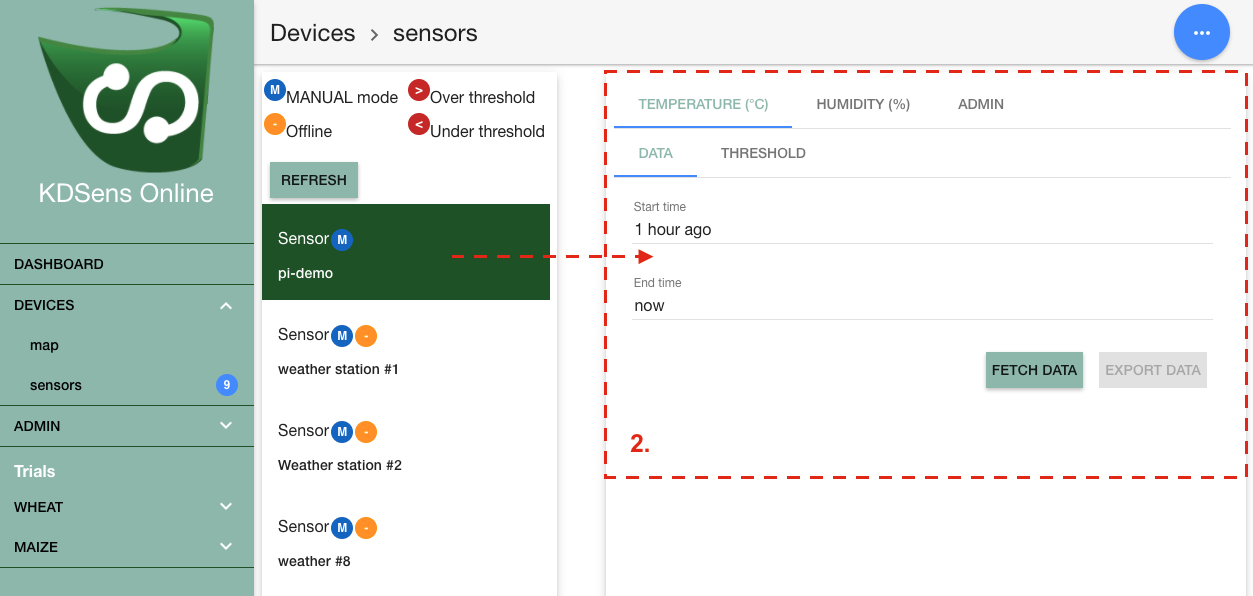
Selecting a device in the list reveals the controls for the device in the right panel (shown at  ).
).
Fetching Device Data
Data collected from a device can be displayed from any recorded time period and KDSens, depending upon the device characteristics, will be able to report multiple variables (e.g. Temperature and Humidity) simultaneously.
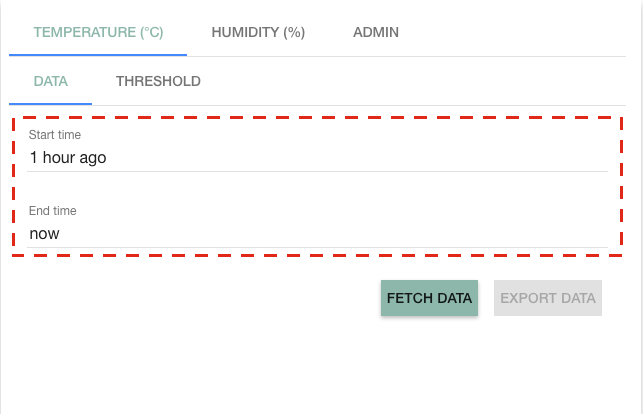
To display the device panel select the variable ‘Temperature (C)’ name at the top of the page at in the following example.
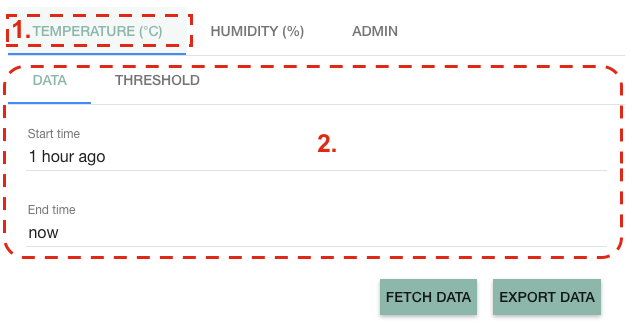
The displayed options shown at are Start time and a End time.
Enter the start period and the end period you wish to inspect.
These fields accept ‘plain English’ requests along with date times. For instance you can enter “1 hour ago” as a start time if required.
Select the FETCH DATA button to retrieve the data between the specified period. As the temperature datatype in this instance is a single decimal, a 2D line plot appears showing the fetched data (seen below).
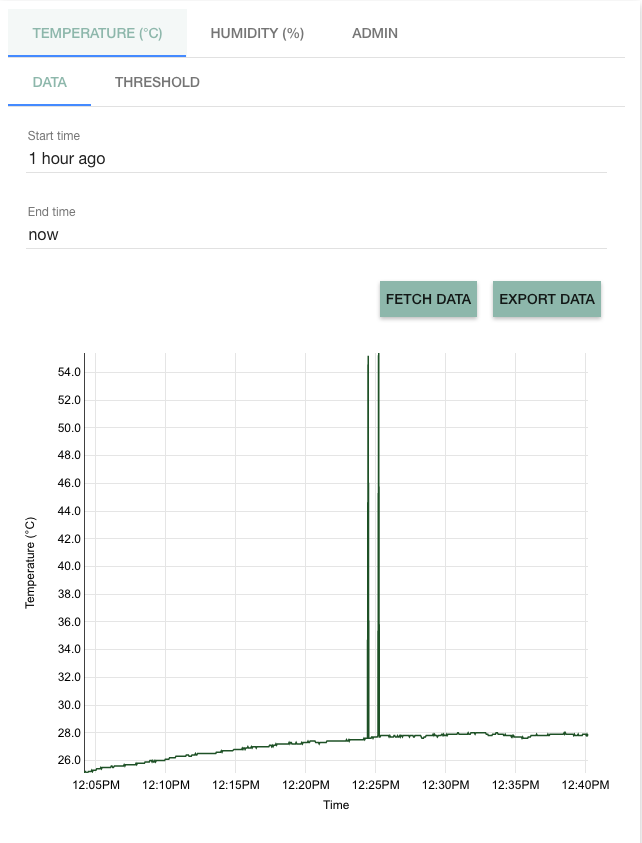
Once data has been fetched it can be downloaded in file format by selecting EXPORT DATA.
Setting Measurement Thresholds
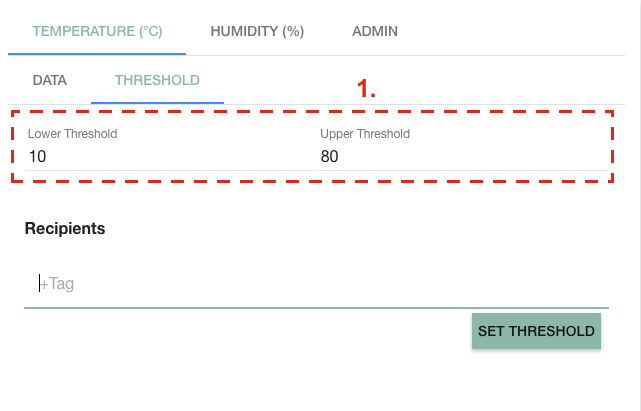
Measurement thresholds can be set for each variable being collected by any device. This is illustrated in the following example at .
In KDSens upper and lower measurement thresholds can be set. When a value reported by the device is then above the higher threshold,or below the lower threshold, KDSens can automatically perform an action such as sending a warning email.
Use case:
- The field for a crop is on an un-even hillside;
- Multiple KDSens sensors are distributed across the field; and
- Objective is to determine and be advised exactly when and where a frost occurs.
KDSens can be used to determine and announce the occurrence of a frost in the field by setting a lower temperature threshold for zero degrees Celsius on all sensors which will send a warning email.
To set higher or lower thresholds for a variable:
- Enter the values in the fields seen below in .
Note It is optional to have either a higher or lower value or both.
- If required email addresses can be added in the Recipients field (Recipients will be emailed if a threshold is exceeded).
- Select Set Threshold.
Switching from Manual to Auto
In KDSens all device data is recorded, although there is a distinction between whether you want data to be stored in your KDDart database, or in the database on your server.
This distinction is referred to as Manual/Automatic mode. By default all devices created in KDSens start in Manual mode.
Manual mode - Data is stored in the KDSens server database.
Automatic mode - Data is sent directly to your KDDart database.
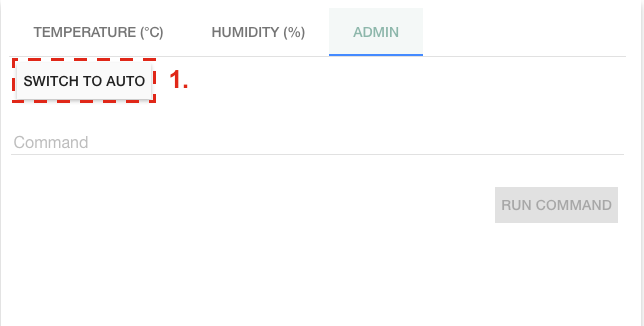
Once the device is properly configured and ready for its collected data to be stored alongside your trial phenotypic/genotypic data in KDDart, you can switch your device into Automatic mode. This is done by simply clicking the “Switch to Auto” button seen below in .
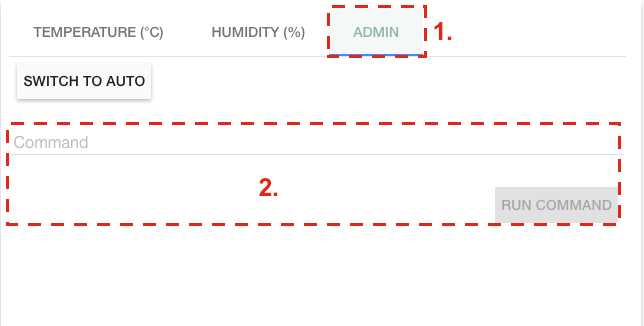
Sending Commands to a Device
Command line control of device in KDSens is presented under the ‘Admin’ tab in the selected device panel (shown in ).
By clicking this tab, a text field is presented. Commands can be entered into this text field, which will be executed on the device.
The results are then presented below the command line field ().